While travelling to our Supercharge Your Science workshop in Cairns and Townsville last week (which, by the way, went off really well and the punters gave us the thumbs up – stay tuned for more Supercharge activities at a university near you…), I stumbled across an article in the Sydney Morning Herald about the state of Australia.
That Commonwealth purveyor of numbers, the Australian Bureau of Statistics (ABS), put together a nice little summary of various measures of wealth, health, politics and environment and their trends over the last decade. The resulting Measures of Australia’s Progress is an interesting read indeed. I felt the simple newspaper article didn’t do the environmental components justice, so I summarise the salient points below and give you my tuppence as well.
The take-home message is pretty simple – on the whole our prosperity is increasing, but our environmental quality is decreasing. No surprises there, really – especially considering our global-scale conclusion that (absolute and per-capita) wealth drives environmental degradation (without, unfortunately, any dip in environmental degradation as per capita wealth increases beyond some imaginary threshold – the so-called Environmental Kuznets Curve).
In Australia, per capita Gross Domestic Product, disposable income, life expectancy and the number of people with a non-school qualification all increased over the last decade, while unemployment and the number of victims of crime decreased. Not bad, you say, especially in the face of a global financial crisis.
Well, the unfortunate truth is that we’ve trashed our environment as a result.
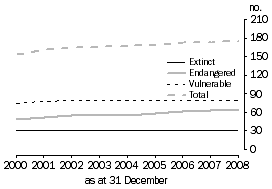
 Between 2000 and 2008, the number of terrestrial bird and mammal species assessed as Extinct, Endangered or Vulnerable (as assessed by the IUCN Red List of Threatened Species) increased by 14% from 154 to 175 (of which 69 were birds and 106 were mammals). At the end of 2008, just 46% of these were Vulnerable, 37% were more seriously threatened, and the rest of them (18%) were presumed extinct. Between 2000 and 2008, there were increases in the number of both Endangered and Vulnerable species. The rise in species assessed as Endangered was higher (an increase of 33%) than those assessed as Vulnerable (an increase of 7%). This isn’t a surprise to those who already know that Australia leads the world in mammal extinctions, but it’s telling that the trend is extending to other taxa such as birds.
For fish populations taken in fisheries managed by the Australian Government, 16 of the 96 principal species assessed (17%) were deemed ‘overfished’ and/or subject to overfishing. This compares with 4 of the 55 species assessed (7%) in 1997 and 24 of the 83 species assessed (29%) in 2005. Commonwealth-managed fisheries account for about 30% of all Australian fisheries by production volume.
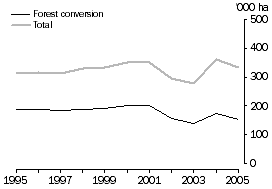
 But it’s not just the species in our land- and oceanscapes that are decling. About 333600 hectares of Australian land was cleared in 2005, which was 6% more than the 314700 hectares cleared in 1995. Of the land cleared in 2005, 152,400 ha (almost half) was ‘forest conversion’ (forest cleared for the first time). This was 18% less than the area converted in 1995 (186900 ha). The annual area of land cleared declined after 2001 but increased again in 2004.
And, Australians are not very good on the emissions front. For 2006, Australia’s net greenhouse gas emissions were about 576.0 megatonnes of CO2-e. Australia’s net emissions in 2006 were 1% lower than in 2005, and 4.2% above 1990 emissions. Emissions tended to rise gradually over the period from 1995, with the sharpest rise occurring between 1997 and 1998 when emissions from land use change rose rather than fell. There was another steep rise between 2004 and 2005. Australia’s energy sector is the largest source of greenhouse gas emissions, rising steadily from 1990 to 2006.
In 2002 (the most recent data available) the National Land and Water Resources Audit assessed the condition of about 1,000 estuaries and found that 50% were near-pristine, 22% were largely unmodified, 19% had been modified and 9% had been extensively modified.
So while we can pat ourselves on the back regarding standard of living, we must be more than cognisant of the effects on our natural environment. Someone the other mentioned a study that recently appeared in BioScience saying that on average, quality of life has improved around the world, but our environment is becoming increasingly degraded. The question is, why haven’t the observed degradation in ecosystem services resulted in declining human prosperity?
I think the answer here is complex, but some elements can be explained right now:
- most measures of ‘prosperity’ do not adequately incorporate all components of well being, especially if they are focused on money
- we do not account for most ecosystem services in our evaluation methods, so the one-dimensional measures of prosperity are too superficial to measure other degraded elements
- we are starting to see direct and indirect reductions in human health resulting from environmental degradation, but this is usually overlooked
- humans have probably not yet crested the population wave; pollination efficiency is declining (and so, therefore, is crop production efficiency), and it’s probably only a matter of time before food (and water) availability lead to severe conflicts and global strife
In other words, just you wait. I await your enlightened comments.
Australian Bureau of Statistics (2010). Measures of Australia’s Progress Report
Raudsepp-Hearne, C., Peterson, G., Tengö, M., Bennett, E., Holland, T., Benessaiah, K., MacDonald, G., & Pfeifer, L. (2010). Untangling the Environmentalist’s Paradox: Why Is Human Well-being Increasing as Ecosystem Services Degrade? BioScience, 60 (8), 576-589 DOI: 10.1525/bio.2010.60.8.4


[…] I’ve seen rather a lot lately in the Australian media about the impending spill vote, and the potential political repercussions of a change (or not), but there’s been nearly no mention of what it all means for the continually degrading Australian environment. […]
LikeLike
[…] I’ve pointed out in several posts on ConservationBytes.com just how badly Australia is doing in the environmental stakes, with massive deforestation continuing since colonial times, feral predators and herbivores blanketing the continent, inadequate protected areas, piss-weak policies and a government at war with its own environment. Despite a few recent wins in marine conservation, Australia has a dreadful track record. […]
LikeLike
[…] the Australian continent, biodiversity is already seriously threatened. Australia has had more mammal extinctions than any other continent, with 27 species disappearing […]
LikeLike
[…] reasons for the decline of Australia’s unique biodiversity are many, and most are well known. Clearing of vegetation for urban and agricultural land uses, […]
LikeLike
Tom:
Thanks for the reference to Ghazoul.
I agree it would be interesting to work out the % by mass of our major food crops that are pollinator dependent. And I think this might be possible through some data available at the FAO website. Just a hunch, but I’ll wager the total production mass of crop material today that is significantly dependent on pollinators (any species) is less than 20% of the total. And not for tidiness, but this contest might benefit by specifying the basis of the mass measurement. Tomato and other fresh fruit crops are typically measured by their fresh weight (this being largely water content). Cereals and pulses are typically measured at market weights that contain considerably less water (13% being common). As the water fraction of the food is still a nutrient by strict definition, I think we’re more interested in the nutrional components of the individual foods beyond their water content.
As for Ghazoul’s paper in general – I find it fairly complete and well argued. And in the final analysis Jaboury does make the point that even though his argument challenges the notion that bee decline is a crisis, it is still an issue worth paying attention to.
LikeLike
It’d be interesting to know what percent by mass of our food (not including meat) is pollinator dependent.
Just had a look at the Potts et al. paper on pollinator declines, and came across one of their references -> Ghazoul, J. (2005) Buzziness as usual? Questioning the global pollination crisis. Trends Ecol. Evol. 20, 367–373. This paper more or less states that the risks are being overstated. He makes some valid points, though I’m very sceptical of his overall conclusion. What do you make of this?
Seeing as fewer than 30 species of plants make up more than 90% of our plant-based diet , it seems we’d certainly be playing with fire by ignoring it. We can’t live healthily on rice, wheat and corn alone.
LikeLike
Gad zooks man, the Bluebird of Hapiness has nothing on you. But still you do make many great points.
As a card carrying quibbler I thought I’d make a remark about connecting pollinator demise (my read on your phrase “pollination efficiency is declining”) too tightly to crop prodution efficiency. Corn for instance is open pollinated and pollen is dispersed on the wind. Wheat is self-pollinated and doesn’t require a pollinator to facilitate pollination. Many other major field crops can also get by without pollinators. For these crops then it would appear crop production efficiency should remain relatively unscathed.
Now please don’t read this to suggest I don’t care about our pollinating insect friends. There are many crops that do in fact depend upon them and I enjoy apples and almonds as much as the next overfed Homo sapien. But in the name of accuracy lets not overstate the value of ecosystem services.
LikeLike
Fair cop, but considering that 75 % of all human crops require pollination by insects (mostly bees), and bees are in decline over a good portion of their global range, I’m worried.
LikeLike
[…] to continue to perpetuate with others of selective hearing and understanding, turning a blind eye to accelerating species loss. I, for one, am not willing to go down the latter […]
LikeLike
[…] continue to perpetuate with others of selective hearing and understanding, turning a blind eye to accelerating species loss. I, for one, am not willing to go down the latter […]
LikeLike