 I’ve just read an elegant little study that has identified the main determinants of differences in the slope of species-area curves and species-accumulation curves.
That’s a bit of a mouthful for the uninitiated, so if you don’t know much about species-area theory, let me give you a bit of background for why this is an important new discovery.
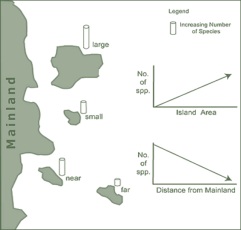
Perhaps one of the only ‘laws’ in ecology comes from the observation that as you sample from larger and larger areas of any habitat type, the number of species tends to increase. This of course originates from MacArthur & Wilson’s classic book, The Theory of Island Biography (1967), and while simple in basic concept, it has since developed into a multi-headed Hydra of methods, analysis, theory and jargon.
One of the most controversial aspects of generic species-area relationships is the effect of different sampling regimes, a problem I’ve blogged about before. Whether you are sampling once-contiguous forest of habitat patches in a ‘matrix’ of degraded landscape, a wetland complex, a coral reef, or an archipelago of true oceanic islands, the ‘ideal’ models and the interpretation thereof will likely differ, and in sometimes rather important ways from a predictive and/or applied perspective.
 Not only is what you sample important, it’s also essential to take into consideration how you sample. The so-called ‘backward’ species area-curve, that predicts extinction arising from habitat loss by moving backward toward the origin on a curve built to estimate the area required to sample the first individual of a species, differs from the ‘endemics-area’ curve, which is the former’s mirror image — the area required to sample the last individual of that species. In a purely theoretical world where species are distributed randomly, these two curves give the same predictions of extinctions from habitat loss; however in reality, species are generally clumped in space. Thus, the area that must be added to find the first individual of a species in general is much smaller than the area that must be removed to eliminate the last individual of a species. So on average it takes a much greater loss of area to cause the extinction of a species than it takes to add the species on first encounter. This problem ignores the idea of extinction lags, but it does demonstrate the necessity of considering the type of sampling regime used to collect the data, as well as the underlying distribution of the species themselves.
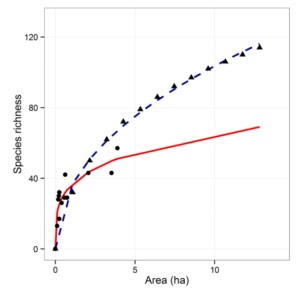
Back to the latest paper by Matthews and colleagues just published in Global Ecology and Biogeography entitled ‘Island species–area relationships and species accumulation curves are not equivalent: an analysis of habitat island datasets‘. For the first time, they explicitly test how species-area relationships derived from true ‘island’ datasets (i.e., number of species occurring within each of a set of islands analysed as a function of the area of each island) differ from species-accumulation curves (i.e., plots of increasing cumulative species number with increasing sampling effort/area).
For many years, the two (admittedly subtly different) ways of estimating species loss or total regional diversity have been considered equivalent. However, Matthews and colleagues show clearly that they often differ in important ways, and that the difference depends mainly on how ‘nested’ the species under investigation are.
‘Nestedness’ relates to the structure of the species community across the ‘islands’ of habitat. In a purely nested community, depauperate island faunas constitute proper subsets of the species in richer islands. When communities are built from many rare species with representatives found in only one or few habitat islands (e.g., because they might they might be drawn from different species pools, or disturbance might affect smaller islands more than larger ones), then nestedness decreases.
As it turns out, when nestedness is high, it tends to reduce the slope of the species-area relationship relative to the species-accumulation curve, with the opposite happening when ‘anti-nestedness’ is apparent. This has major implications for predicting extinction risk as well as regional species richness (γ-diversity).
The paper uses a rather impressive number of existing datasets, several types of analyses, and simulations to demonstrate the point. It’s yet another timely demonstration that the underlying sampling strategy as well as the distribution of the species themselves must absolutely be taken into account before making any sort of predictions from species-area relationships.


[…] species-area curve, where the number of species increases with area […]
LikeLike
[…] that sacrificing big wetlands instead of small ones would do less overall harm, mainly because the species-area relationship predicts bigger patches to have more […]
LikeLike