 I had an interesting ‘discussion’ on Twitter yesterday that convinced me the topic would make a useful post. The specific example has nothing whatsoever to do with conservation, but it serves as a valuable statistical lesson for all concerned about demonstrating adequate evidence before jumping to conclusions.
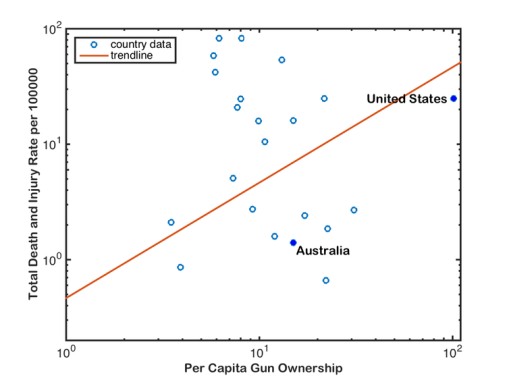
The data in question were used in a correlation between national gun ownership (guns per capita) and gun-related deaths and injuries (total deaths and injuries from guns per 100,000 people) (the third figure in the article). As you might intuitively expect, the author concluded that there was a positive correlation between gun-related deaths and injuries, and gun ownership:
__
Now, if you’re an empirical skeptic like me, there was something fishy about that fitted trend line. So, I replotted the data (available here) using Plot Digitizer (if you haven’t yet discovered this wonderful tool for lifting data out of figures, you would be wise to get it now), and ran a little analysis of my own in R:
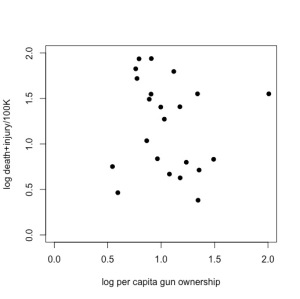
Just doing a little 2-parameter linear model (y ~ α + βx) in R on these log-log data (which means, it’s assumed to be a power relationship), shows that there’s no relationship at all — the intercept is 1.3565 (± 0.3814) in log space (i.e., 101.3565 = 22.72), and there’s no evidence for a non-zero slope (in fact, the estimated slope is negative at -0.1411, but it has no support). See R code here.
Now, the author pointed out what appears to be a rather intuitive requirement for this analysis — you should not have a positive number of gun-related deaths/injuries if there are no guns in the population; in other words, the relationship should be forced to go through the origin (x, y = 0, 0). You can easily do this in R by using the lm function and setting the relationship to y ~ 0 + x; see code here).
Sounds reasonable, and if you take it on face value, it justifies the purported positive relationship shown in the original article. Suddenly, the slope is now positive (1.0308 ± 0.1236) and supported statistically.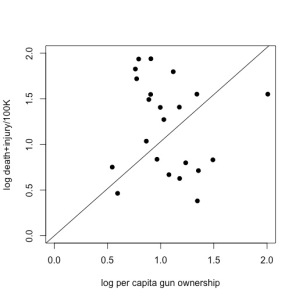
But slow-down there, matey! There’s a problem here, and it means everything for the interpretation of the relationship. Just because it’s intuitive and you can force the relationship to go through the origin, it doesn’t mean that the data support this approach.
If you look closely, you’ll see that the origin is far away from the nearest real data — in other words, we’re taking a huge leap by assuming the relationship continues from the lowest values in the dataset back to the origin. You’ll also notice that the outlier (the USA: point farthest to the right of the plot) seems to be driving much of this relationship.
What we need to do is examine the relative support for the 2-parameter (intercept + slope) model versus the origin model. We can do this easily by comparing the sample size-corrected Akaike’s information criterion (AICc) for each model, and then dividing the AICc for the full model by the AICc of the origin model; this is called the information-theoretic evidence ratio.
As you can see from the code, the evidence ratio is 56.8, which means that the 2-parameter model is ~ 57 times more likely than the origin model after accounting for the different number of estimated parameters in each.
As such, there is no statistical justification whatsoever to support the forced-origin model, even though it seems to make intuitive sense (see another useful discussion here). This is because we have overstepped the bounds of our inference capacity based on the small sample of data available.
Now, in this particular case, I admit that even I wanted this relationship to be real, for I am a firm supporter of extensive gun control (the many other data supporting why this makes sense are overwhelming). I am, in fact, a gun owner myself (for scientific and farming purposes), and I am in absolute favour of the tightest gun-control legislation possible.
But just because I want it to be true, doesn’t make it so. We have to stick to the evidence.


I wonder if the line passing through the origin is a reasonable assumption at all – I suspect that the number of guns is always bigger than the number of legitimately owned (i.e. licensed) guns, and if the illegal guns are used to shoot people the line will intercept the Y axis above zero. As you say – don’t assume what you haven’t measured.
On a more general level – how often is an assumption of linearity (even on transformed data) reasonable for natural phenomena ? – and is there any point at all (besides conclusion-based evidence-making) for presenting a line without its confidence limits, which in this case my eyeballs tell me will extend beyond the borders of the chart ?
LikeLike