 Just under two weeks ago, Giovanni Strona and I published a paper in Scientific Reports on measuring the co-extinction effect from climate change. What we found even made me — an acknowledged pessimist — stumble in shock and incredulity.
But a bit of back story is necessary before I launch into describing what we discovered.
Last year, some Oxbridge astrophysicists (David Sloan and colleagues) published a rather sensational paper in Scientific Reports claiming that life on Earth would likely survive in the face of cataclysmic astrophysical events, such as asteroid impacts, supernovae, or gamma-ray bursts. This rather extraordinary conclusion was based primarily on the remarkable physiological adaptations and tolerances to extreme conditions displayed by tardigrades1 — those gloriously cute, but tiny (most are around 0.5 mm long as adults) ‘water bears’ or ‘moss piglets’ — could you get any cuter names?
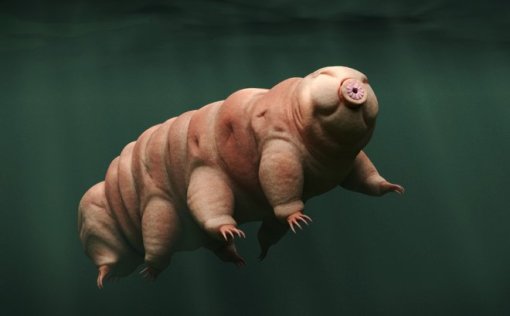
Found almost everywhere and always (the first fossils of them date back to the early Cambrian over half a billion years ago), these wonderful little creatures are some of the toughest metazoans (multicellular animals) on the planet. Only a few types of extremophile bacteria are tougher.
So, boil, fry or freeze the Earth, and you’ll still have tardigrades around, concluded Sloan and colleagues.
When Giovanni first read this, and then passed the paper along to me for comment, our knee-jerk reaction as ecologists was a resounding ‘bullshit!’. Even neophyte ecologists know intuitively that because species are all interconnected in vast networks linked by trophic (who eats whom), competitive, and other ecological functions (known collectively as ‘multiplex networks’), they cannot be singled out using mere thermal tolerances to predict the probability of annihilation.
Co-extinctions — the phenomenon of species going extinct because the species on which they depend go extinct first — mean that defaulting to physiological tolerances alone would severely underestimate extinction rates. But by how much?
Giovanni and I immediately responded to the journal that the Sloan conclusions could not be defended because of this simple fact. But they refused to publish the response because we could not quantify by how much they underestimated extinction.
Well, “fair enough”, we said. So, we set about trying to do the impossible — estimate the global extinction rate of species facing planetary catastrophes with co-extinctions taken into account.
As you can imagine, that was no easy task.
Fortunately, Giovanni is a superlative ecologist and coder, and so we started from the ground up and built a vast stochastic network model to create ‘virtual Earths’ that mimicked observed species’ interactions and trophic hierarchies. The models started out fairly simple, but quickly morphed into complex-systems beasts as we added successively more complex ecological function and structure. For example, we built trophic networks by selecting species within today’s observed trophic levels for plants, ectotherms, and endotherms, randomly applied functional traits to each species to modify the interactions, including dispersal of ‘invasive’ species and the probability of displacing ‘native’ ones, trophic rewiring following primary extinctions, and various adaptation algorithms. And we did all this within a ‘spatial’ distribution mimicking latitudinal variation in climate conditions (you can check out all the associated machinery in the paper’s Methods and Supplementary material).
You can also check out this little infographic made for the paper’s media release:
While this beast of a model is probably one of the most ecologically realistic, global-scale networks yet built, it is still of course a gross simplification of how life interacts on the planet. That said, the structure allowed us to address the very question posed to us in the rejection letter of our first comment — how much do co-extinctions play a role in global extinction rates?
Our two main scenarios were whether we considered only primary extinctions from exceeding thermal tolerances via either a trajectory of planetary cooling (nuclear winter) or heating (global warming), or whether we also included co-extinctions resulting from the primary ones. We also had a subset of extremophile ‘tardigrade’ species that we tracked separately within both scenarios and temperature trajectories.
The results were striking. While expected, we didn’t really think the global warming scenario would be so bad; but extinction rates including co-extinctions were up to over ten times higher than those based only on exceeding heat tolerances. In the planetary cooling trajectory, however, the median bias was ‘only’ about twice as high. This difference arose because plants tend to drop out faster in the warming trajectory, thus leading to many more extinctions up the food web from herbivores to carnivores.
But what was really shocking was what we found when we tried to design the perfect storm of ecological demise. Here, we took the worst-case scenario of extinctions by lopping off the ecologically most important (i.e., best connected) species first in each network, followed by the second-most important species, and so on in order right down to the least-important. This of course resulted in the fastest overall annihilation of all species, but it was nearly identical to the extinction curve resulting from the planetary heating trajectory.
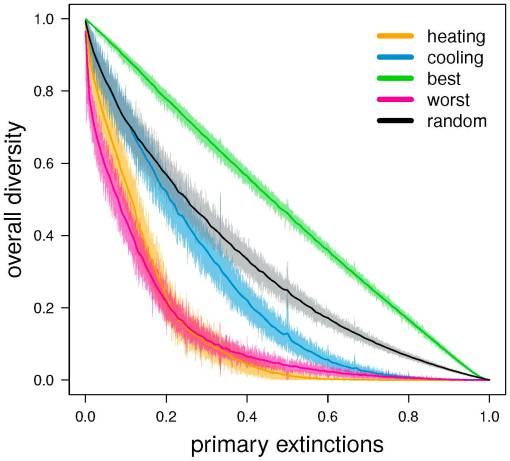
Figure 2 from Strona & Bradshaw: Simulated food webs are more robust to global cooling than to heating. We evaluated robustness by ‘disassembling’ a random sample of 1000 food webs. Disassembly consisted of removing species progressively from the least to the most tolerant to warm (‘heating’) or cold (‘cooling’) temperatures. We simulated coextinctions after each species removal, and then plotted the curves depicting the (co-extinction driven) decline of local diversity following direct species removal. To obtain approximate upper and lower boundaries of robustness, we did two additional disassembly simulations for each food web by removing species in increasing (‘best’) or decreasing (‘worst’) order of their expected contribution to network persistence (measured as the number of associated resources per species). For each food web, we also obtained a reference curve by removing species in random order (‘random’). Solid lines represent mean values, while shaded areas indicate 99% confidence intervals.
This basically means that global warming is the worst possible mechanism driving extinctions, and why we have most likely vastly underestimated extinctions arising from projected climate change in the near future. Shit.
I need a drink.
1Very likely my favourite animal taxon — the top position for me vacillates between tardigrades and onychophorans (Peripatus or ‘velvet worms’), because the evolutionary link between worms and arthropods is just too cool for school.


[…] extinction of infrastructure/key species that then precipitates co-extinction cascades; […]
LikeLike
[…] so many indices, it’s difficult to know what to use to examine relative performance. And with climate change ramping up, we’re all doing badly no matter which country you’re from. Hopefully some nations can avoid the worst of the […]
LikeLike
[…] Climate change will also guarantee additional (perhaps even most) future extinctions irrespective of Australian […]
LikeLike
[…] When they can’t change fast enough, they go extinct. […]
LikeLike
[…] recent online interview I did on the role of extinction cascades in mass […]
LikeLike
[…] a species’ thermal tolerance4. In fact, climate disruption-driven extinction rates could be up to ten times higher than currently predicted4 when extinction cascades are taken into […]
LikeLike
[…] of this blog will know, we are smack in the middle of the world’s sixth mass extinction. Climate change is apocalyptic, for sure, but it is merely one (strong) driver of extinctions among many. I worry for the species […]
LikeLike
[…] first event happened a few weeks ago after we did a press release about our paper on co-extinction cascades published in Scientific Reports. Yes, it got into a few big newspapers and radio, but I thought it […]
LikeLike
[…] first event happened a few weeks ago after we did a press release about our paper on co-extinction cascades published in Scientific Reports. Yes, it got into a few big newspapers and radio, but I thought it […]
LikeLike