Cartoon guide to biodiversity loss XXX 30

27 05 2015

[10.06.2015 update: Because of all the people looking for cartoon porn, I’ve slightly altered the title of this post. Should have predicted that one]

Third batch of six biodiversity cartoons for 2015 (see full stock of previous ‘Cartoon guide to biodiversity loss’ compendia here).

Read the rest of this entry »


Dawn of life

18 05 2015
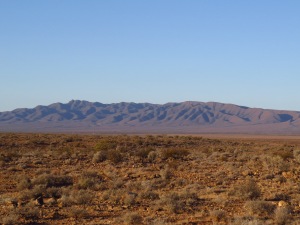
Looking east toward the northern Flinders Ranges from Ediacara Conservation Park. © CJA Bradshaw

Looking east toward the northern Flinders Ranges from Ediacara Conservation Park. © CJA Bradshaw

I’ve had one of the most mind-blowing weeks of scientific discovery in my career, and it’s not even about a subject from within my field.

As some of you might know, I’ve been getting more and more interested in palaeo-ecology over the past few years. I’m fascinated by the challenge of reconstructing past communities and understanding how and why they changed. It’s a natural progression for someone interested in modern extinction dynamics.

Most of my recent interests have focussed on palaeo-communities of the Late Quaternary, and mainly in the range of 100 thousand years ago to the present. We’ve started publishing a few things in this area, and I can confirm that they’ll be plenty more to come in the following months and years. Despite plenty more to do in the youngest of palaeo-communities, I’ve now been bitten by the deep-time bug.

The giant Dickinsonia rex - a flat, worm-like discoid animal. © D. García-Bellido

The giant Dickinsonia rex – a flat, worm-like discoid animal. © D. García-Bellido

When I write ‘deep time’, I bloody well mean it: back to 580 million years, to be accurate. This is the time before the great Cambrian explosion of life popularised by the late Stephen Jay Gould in his brilliant book, Wonderful Life1,2. I’m talking about the Ediacaran period from 635-541 million years ago.

I’ve lived in South Australia now for over seven years, but it was only in the last few that I realised the Ediacaran was named after the Ediacara Hills in the northern Flinders Ranges some 650 km north of Adelaide where I live, and it wasn’t until last week that I had the extremely gratifying privilege of visiting the region with some of the world’s top Ediacaran specialists. If you have even the remotest interest in geological time and the origin of life on Earth, you should make a pilgrimage to the Flinders Ranges at some point before you die.

Read the rest of this entry »


Statistical explainer: average temperature increases can be deceiving

12 05 2015

Beating-the-Heat-Without-PowerOver the years I’ve used a simple graphic from the IPCC 2007 Report to explain to people without a strong background in statistics just why average temperature increases can be deceiving. If you’re not well-versed in probability theory (i.e., most people), it’s perhaps understandable why so few of us appear to be up-in-arms about climate change. I posit that if people had a better appreciation of mathematics, there would be far less inertia in dealing with the problem.

Instead of using the same image, I’ve done up a few basic graphs that explain the concept of why average increases in temperature can be deceiving; in other words, I explain why focussing on the ‘average’ projected increases will not enable you to appreciate the most dangerous aspects of a disrupted climate – the frequency of extreme events. Please forgive me if you find this little explainer too basic – if you have a modicum of probability theory tucked away in your educational past, then this will be of little insight. However, you may wish to use these graphs to explain the problem to others who are less up-to-speed than you.

Let’s take, for example, all the maximum daily temperature data from a single location compiled over the last 100 years. We’ll assume for the moment that there has been no upward trend in the data over this time. If you plot the frequency of these temperatures in, say, 2-degree bins over those 100 years, you might get something like this:
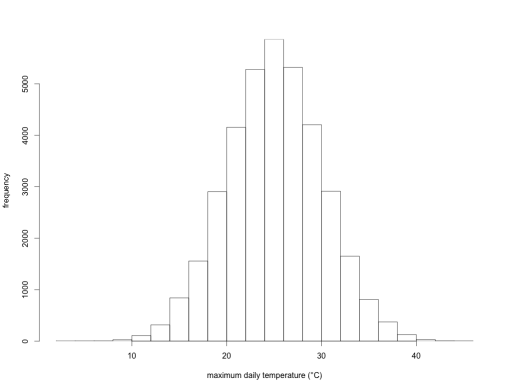
ClimateVarFig0.1

This is simply an illustration, but here the long-term annual average temperature is 25 degrees Celsius, and the standard deviation is 5 degrees. In other words, over those 100 years, the average daily maximum temperature is 25 degrees, but there were a few days when the maximum was < 10 degrees, and a few others where it was > 40 degrees. This could represent a lot of different places in the world.

We can now fit what’s known as a ‘probability density function’ to this histogram to obtain a curve of expected probability of any temperature within that range:

ClimateVarFig0.2

If you’ve got some background in statistics, then you’ll know that this is simply a normal (Gaussian) distribution. With this density function, we can now calculate the probability of any particular day’s maximum temperature being above or below any particular threshold we choose. In the case of the mean (25 degrees), we know that exactly half (p = 0.50) of the days will have a maximum temperature below it, and exactly half above it. In other words, this is simply the area under the density function itself (the total area under the entire curve = 1). Read the rest of this entry »



Twenty tips for writing a research proposal

4 05 2015

Proposal FormatThis post’s title might promise a lot, but it would be disingenuous of me to imply that I could cover all of the essential components of this massive topic in one blog post. Many people (my wife included) have made careers out of teaching people how to write successful grant proposals, so I won’t pretend to be comprehensive and insult their expertise. That said, I’ve been reasonably successful on the grants’ side of the science game, and I’ve assessed a fair few grant proposals in my day, so I think I can offer at least a few pointers. As usual, each person probably has her or his own way of doing things, so there’s unlikely to be a single, winning method. Approaches will also vary by funding agency and country of origin. I am therefore targeting the earlier-career people who have yet to get fully indoctrinated into the funding cycle, with generalities that should apply to most grant proposals.

1. A proposal is not an article, so don’t try to write it as one.

In the huge list of things ‘they never taught you as a student, but need to know to be a successful scientist’, this has got to be one of the biggies. Now I’m mainly talking about science here, but grant proposals cannot and should not follow the standard format of peer-reviewed articles. Articles tend to put an elaborate background up front, a complex description of hypotheses followed by an even more complex description of methods and results. Do not do this for a proposal. A proposal should be viewed more as a ‘pitch’ that hooks the assessor’s attention from the get-go. More on this aspect below.

2. Understand what the funder actually fundsRead the rest of this entry »