 I do a lot of grant assessments for various funding agencies, including two years on the Royal Society of New Zealand’s Marsden Fund Panel (Ecology, Evolution, and Behaviour), and currently as an Australian Research Council College Expert (not to mention assessing a heap of other grant applications).
Sometimes this means I have to read hundreds of proposals made up of even more researchers, all of whom I’m meant to assess for their scientific performance over a short period of time (sometimes only within a few weeks). It’s a hard job, and I doubt very much that there’s a completely fair way to rank a researcher’s ‘performance’ quickly and efficiently.
It’s for this reason that I’ve tried to find ways to rank people in the most objective way possible. This of course does not discount reading a person’s full CV and profile, and certainly taking into consideration career breaks, opportunities, and other extenuating circumstances. But I’ve tended to do a first pass based primarily on citation indices, and then adjust those according to the extenuating circumstances.
But the ‘first pass’ part of the equation has always bothered me. We know that different fields have different rates of citation accumulation, that citations accumulate with age (including the much heralded h-index), and that there are gender (and other) biases in citations that aren’t easily corrected.
I’ve generally relied on the ‘m-index’, which is simply one’s h-index divided by the number of years one has been publishing. While this acts as a sort of age correction, it’s still unsatisfactory, essentially because I’ve noticed that it tends to penalise early career researchers in particular. I’ve tried to account for this by comparing people roughly within the same phase of career, but it’s still a subjective exercise.
I’ve recently been playing with an alternative that I think might be a way forward. Bear with me here, for it takes a bit of explaining.
- Let’s first acknowledge that just like journal ranks, a researcher’s citation performance should only be viewed as relative to a comparison group. An absolute value is somewhat meaningless.
- If we have a sample of researchers (say, a list of people applying for the same job), then we should have people largely within a similar phase of career. Even if this is not the case, they should at least all be within a (roughly) similar discipline.
- Given that the m-index is unsatisfactory for the reasons I described above, and that taking the time to understand all the historical nuances of a particular researcher’s publication history is intractable from the perspective of assessment, we ideally need an index that can be created quickly.
- I therefore propose that based on open-access Google Scholar profiles, there are four values readily available: (i) i10 index (number of publications with at least 10 citations), (ii) h-index (number of publications with at least the same number of citations), (iii) publication with the most citations (cmax), and (iv) the year of first publication. This last one can be a bit tricky, but my rule of thumb is only to count the year when the researcher published her first peer-reviewed journal article.
- We can then build a simple power-law model between the number of articles adhering to the specifications of first three values (i10, h-index, cmax) and their respective index value (i.e., 10, h-index, 1). This equates to a linear model using the log10 of each series (i.e., log10(i10), log10(h-index), log10(cmax) versus log10(10), log10(h-index), log10(1)). I tried this with a reasonably random sample of 26 female and 26 male researchers, most with whom I haven’t collaborated (but I myself am in the sample). I tried to get a wide range of citations (h-index range: 5 to 155) and experience (range: 5 to 66 years publishing). Without revealing identities, the following graph shows the linear fits to the log-log series:
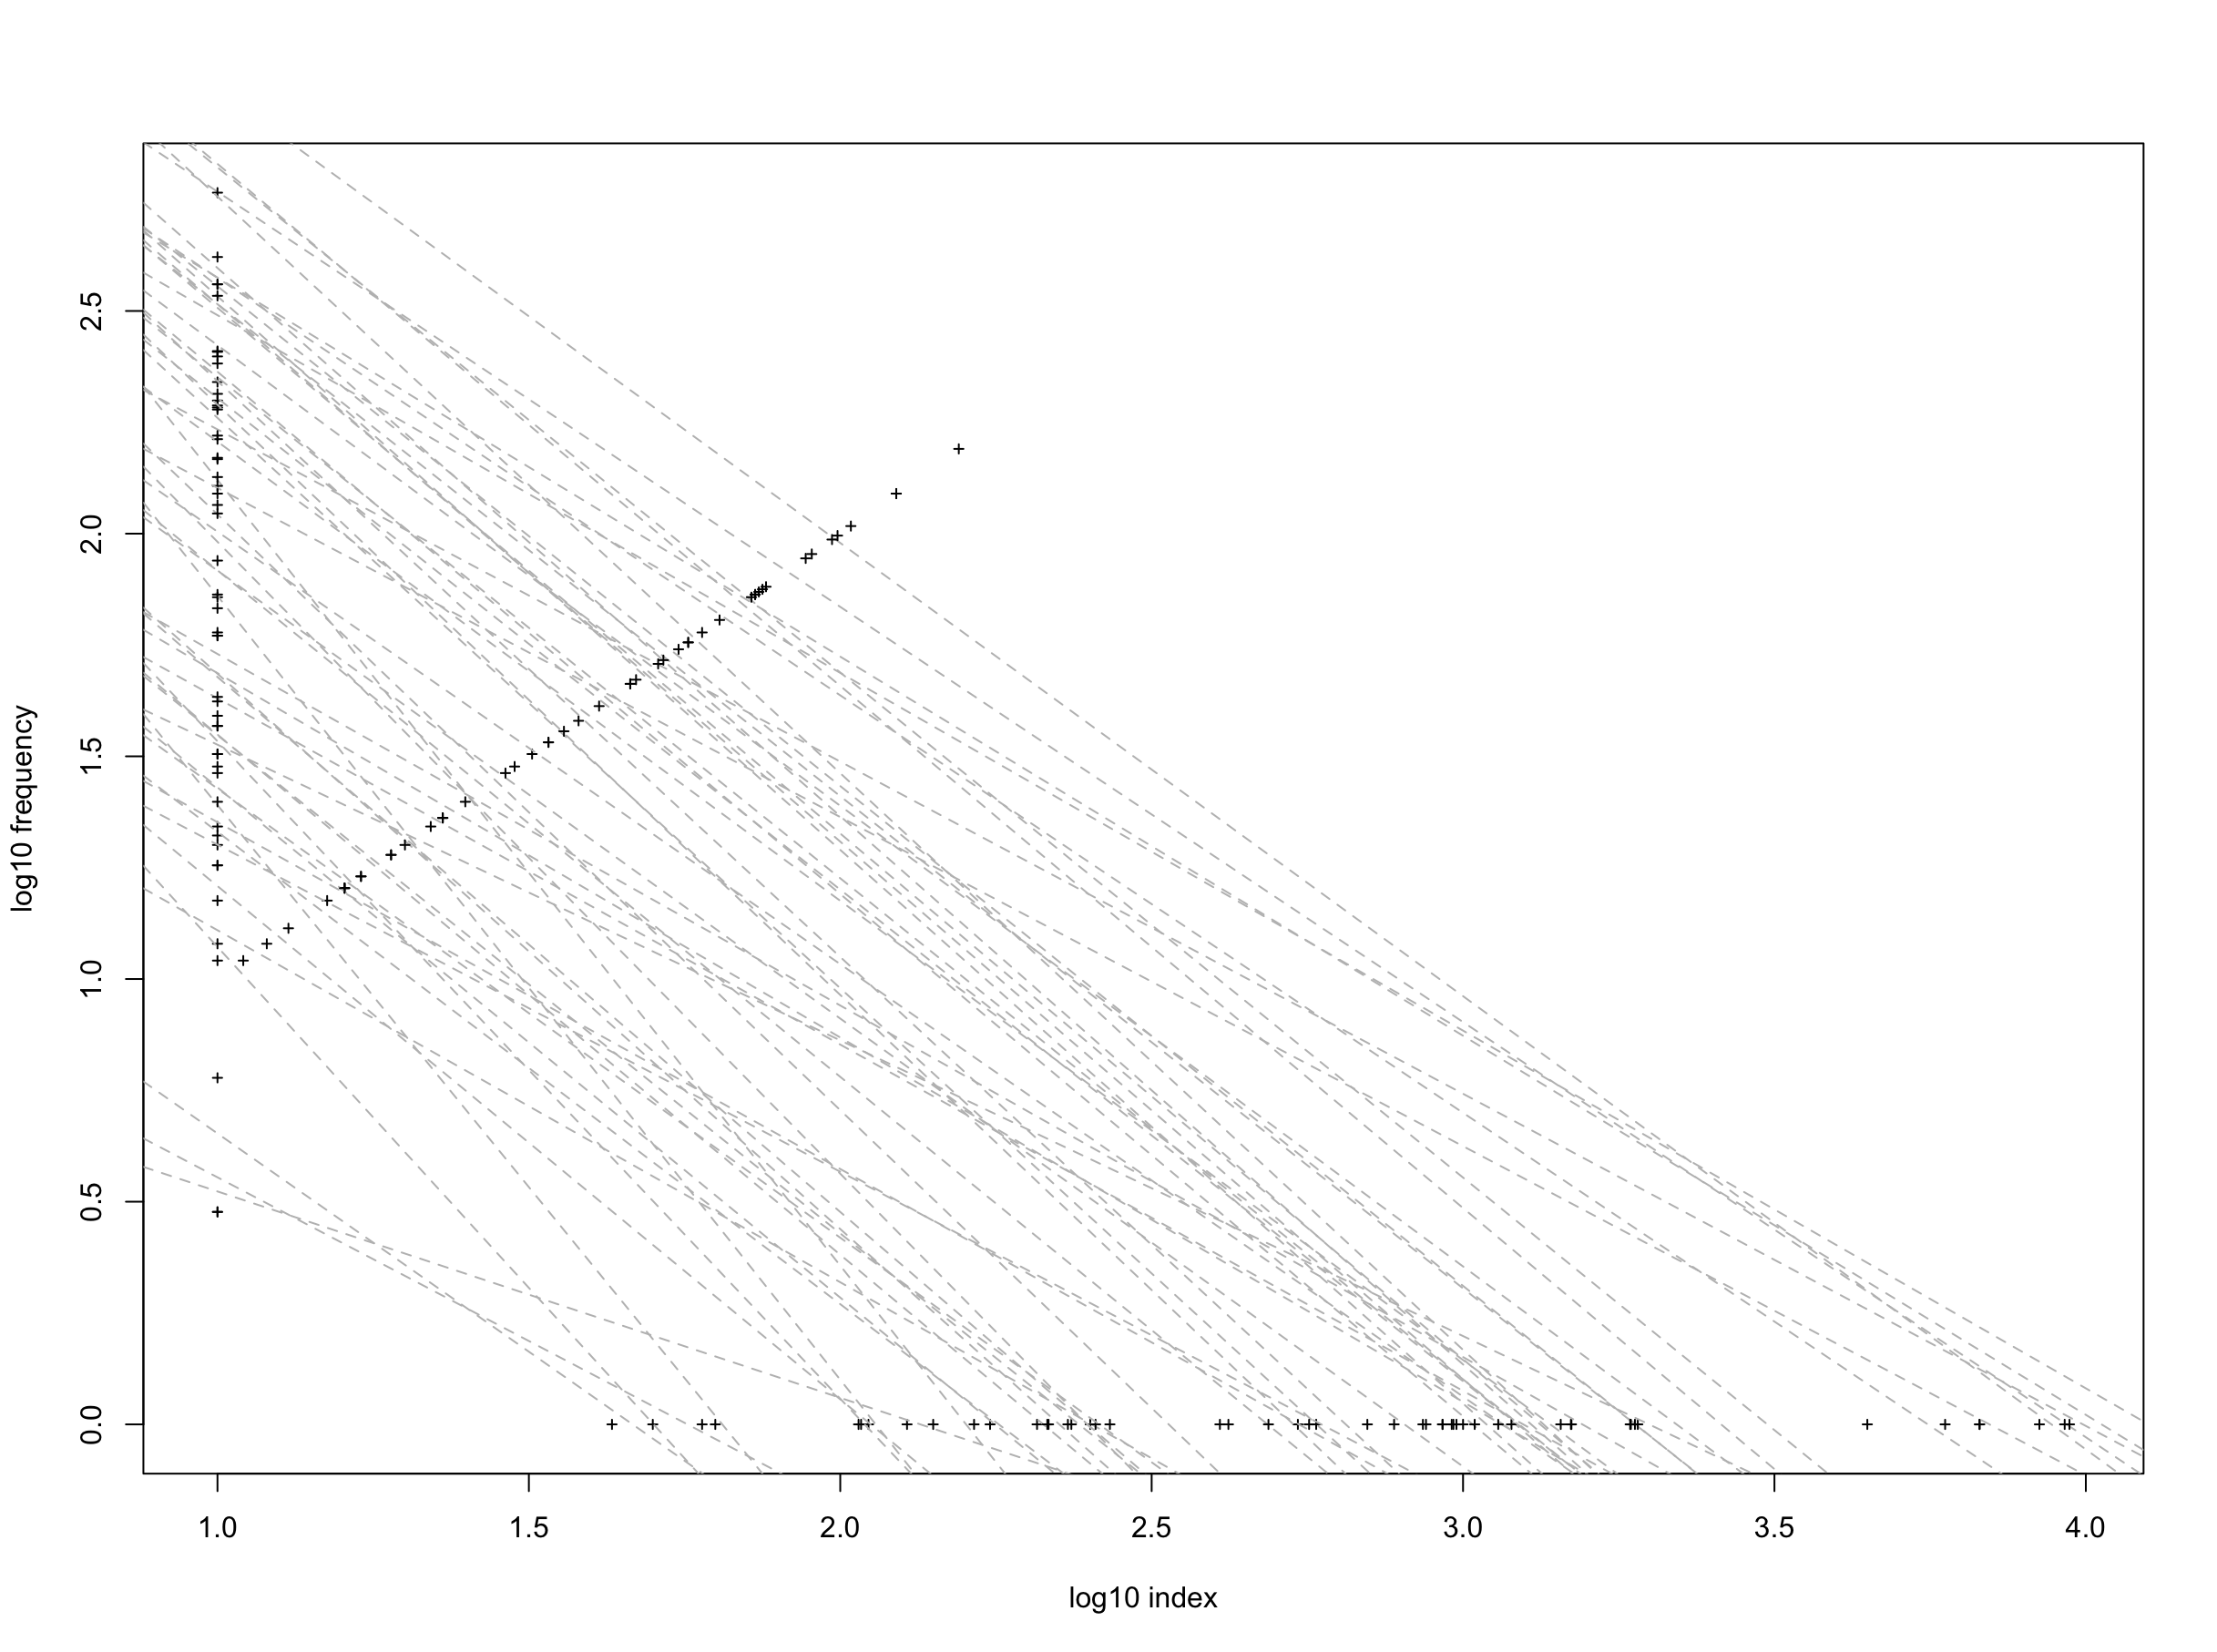
- Then, we calculate the integral of this relationship (i.e., area under the curve), with the maximum value set to the maximum cmax across all individual researchers in the sample.
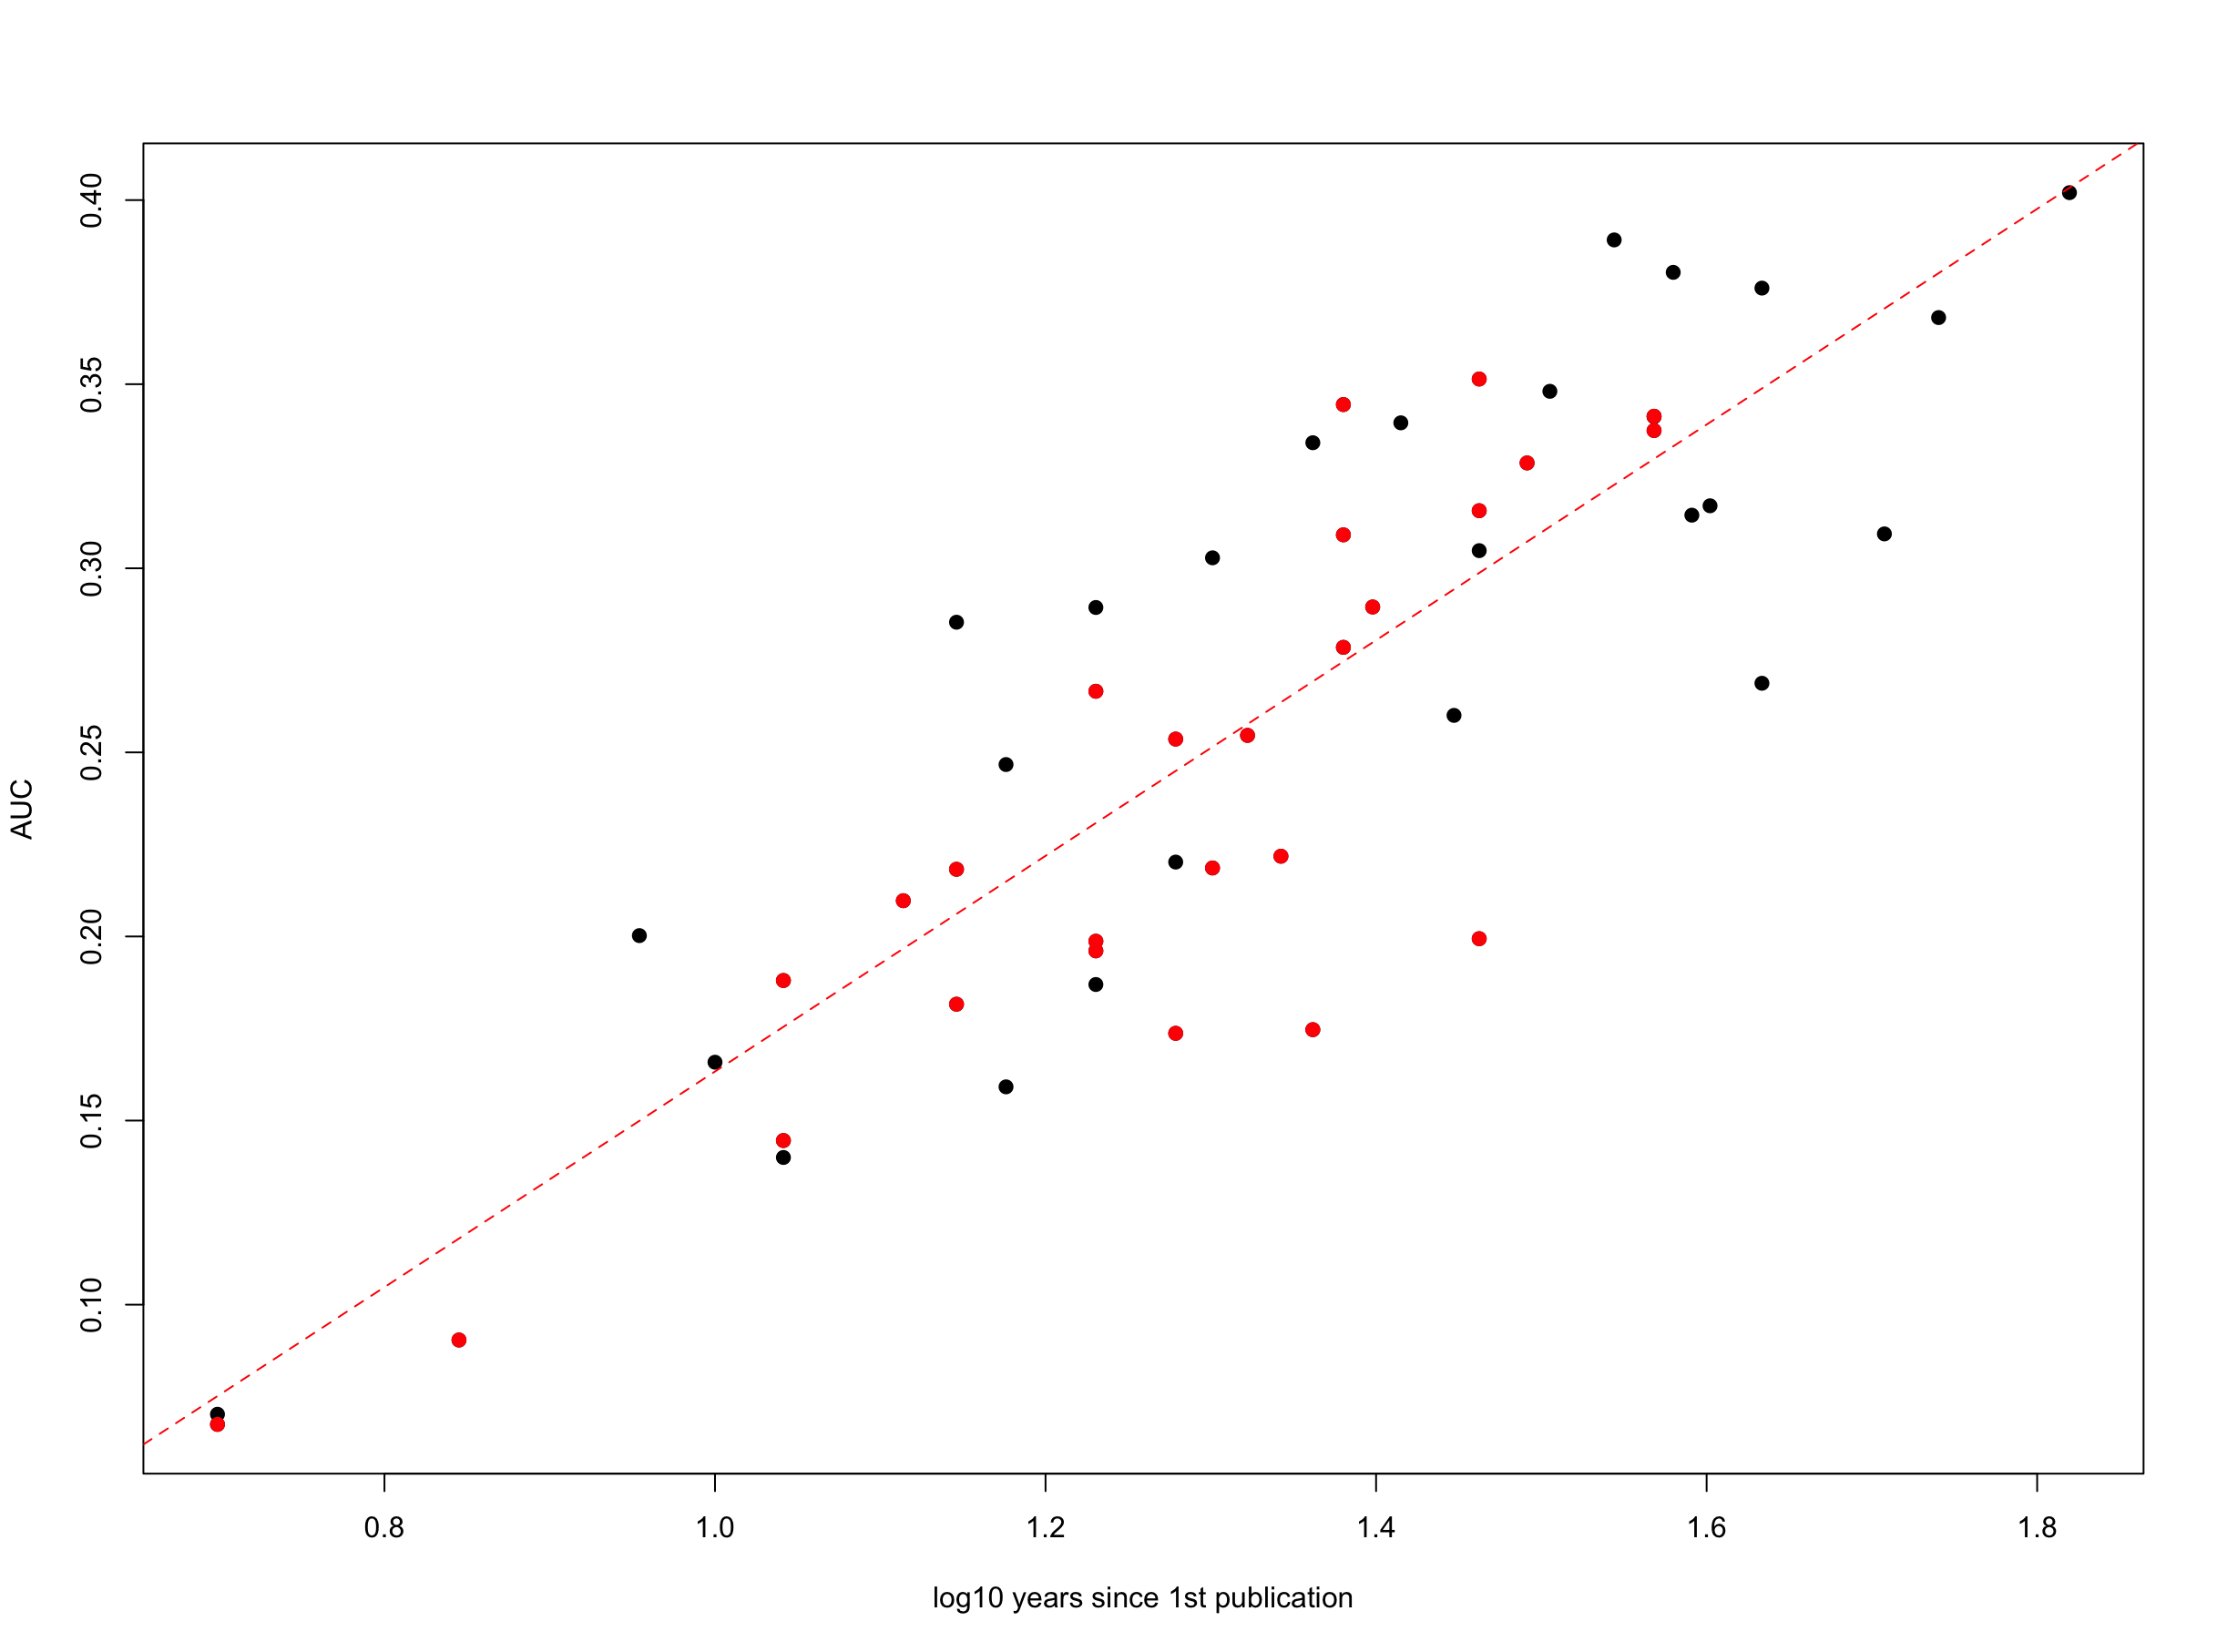
- Plotting the area under the curve against the log10 of the number of years the researcher has been publishing (current year – year of first publication), we get a nice, well-behaved Gaussian-like relationship.
- From this, we can fit a simple linear model (y = a + bx), and then calculate the residuals for each researcher in the sample. If a researcher’s residual is positive, we can conclude that she is performing above expectation (relative to the group), and if negative, below expectation (with the magnitude of the difference between residuals representing relative performance).
- Ranking the residuals can also give a nice, non-parametric scale for all researchers in the sample.
And here’s that same sample of 26 women and 26 men with their integrals (AUC = area under the curve) plotted against the log of years publishing (women in red; men in black):
I won’t show the residual rankings here, because it’s sort of irrelevant for demonstrative purposes. However, I will show the histograms of h-index, m-index, and the AUC-log10(years since first publication) residuals for comparison:
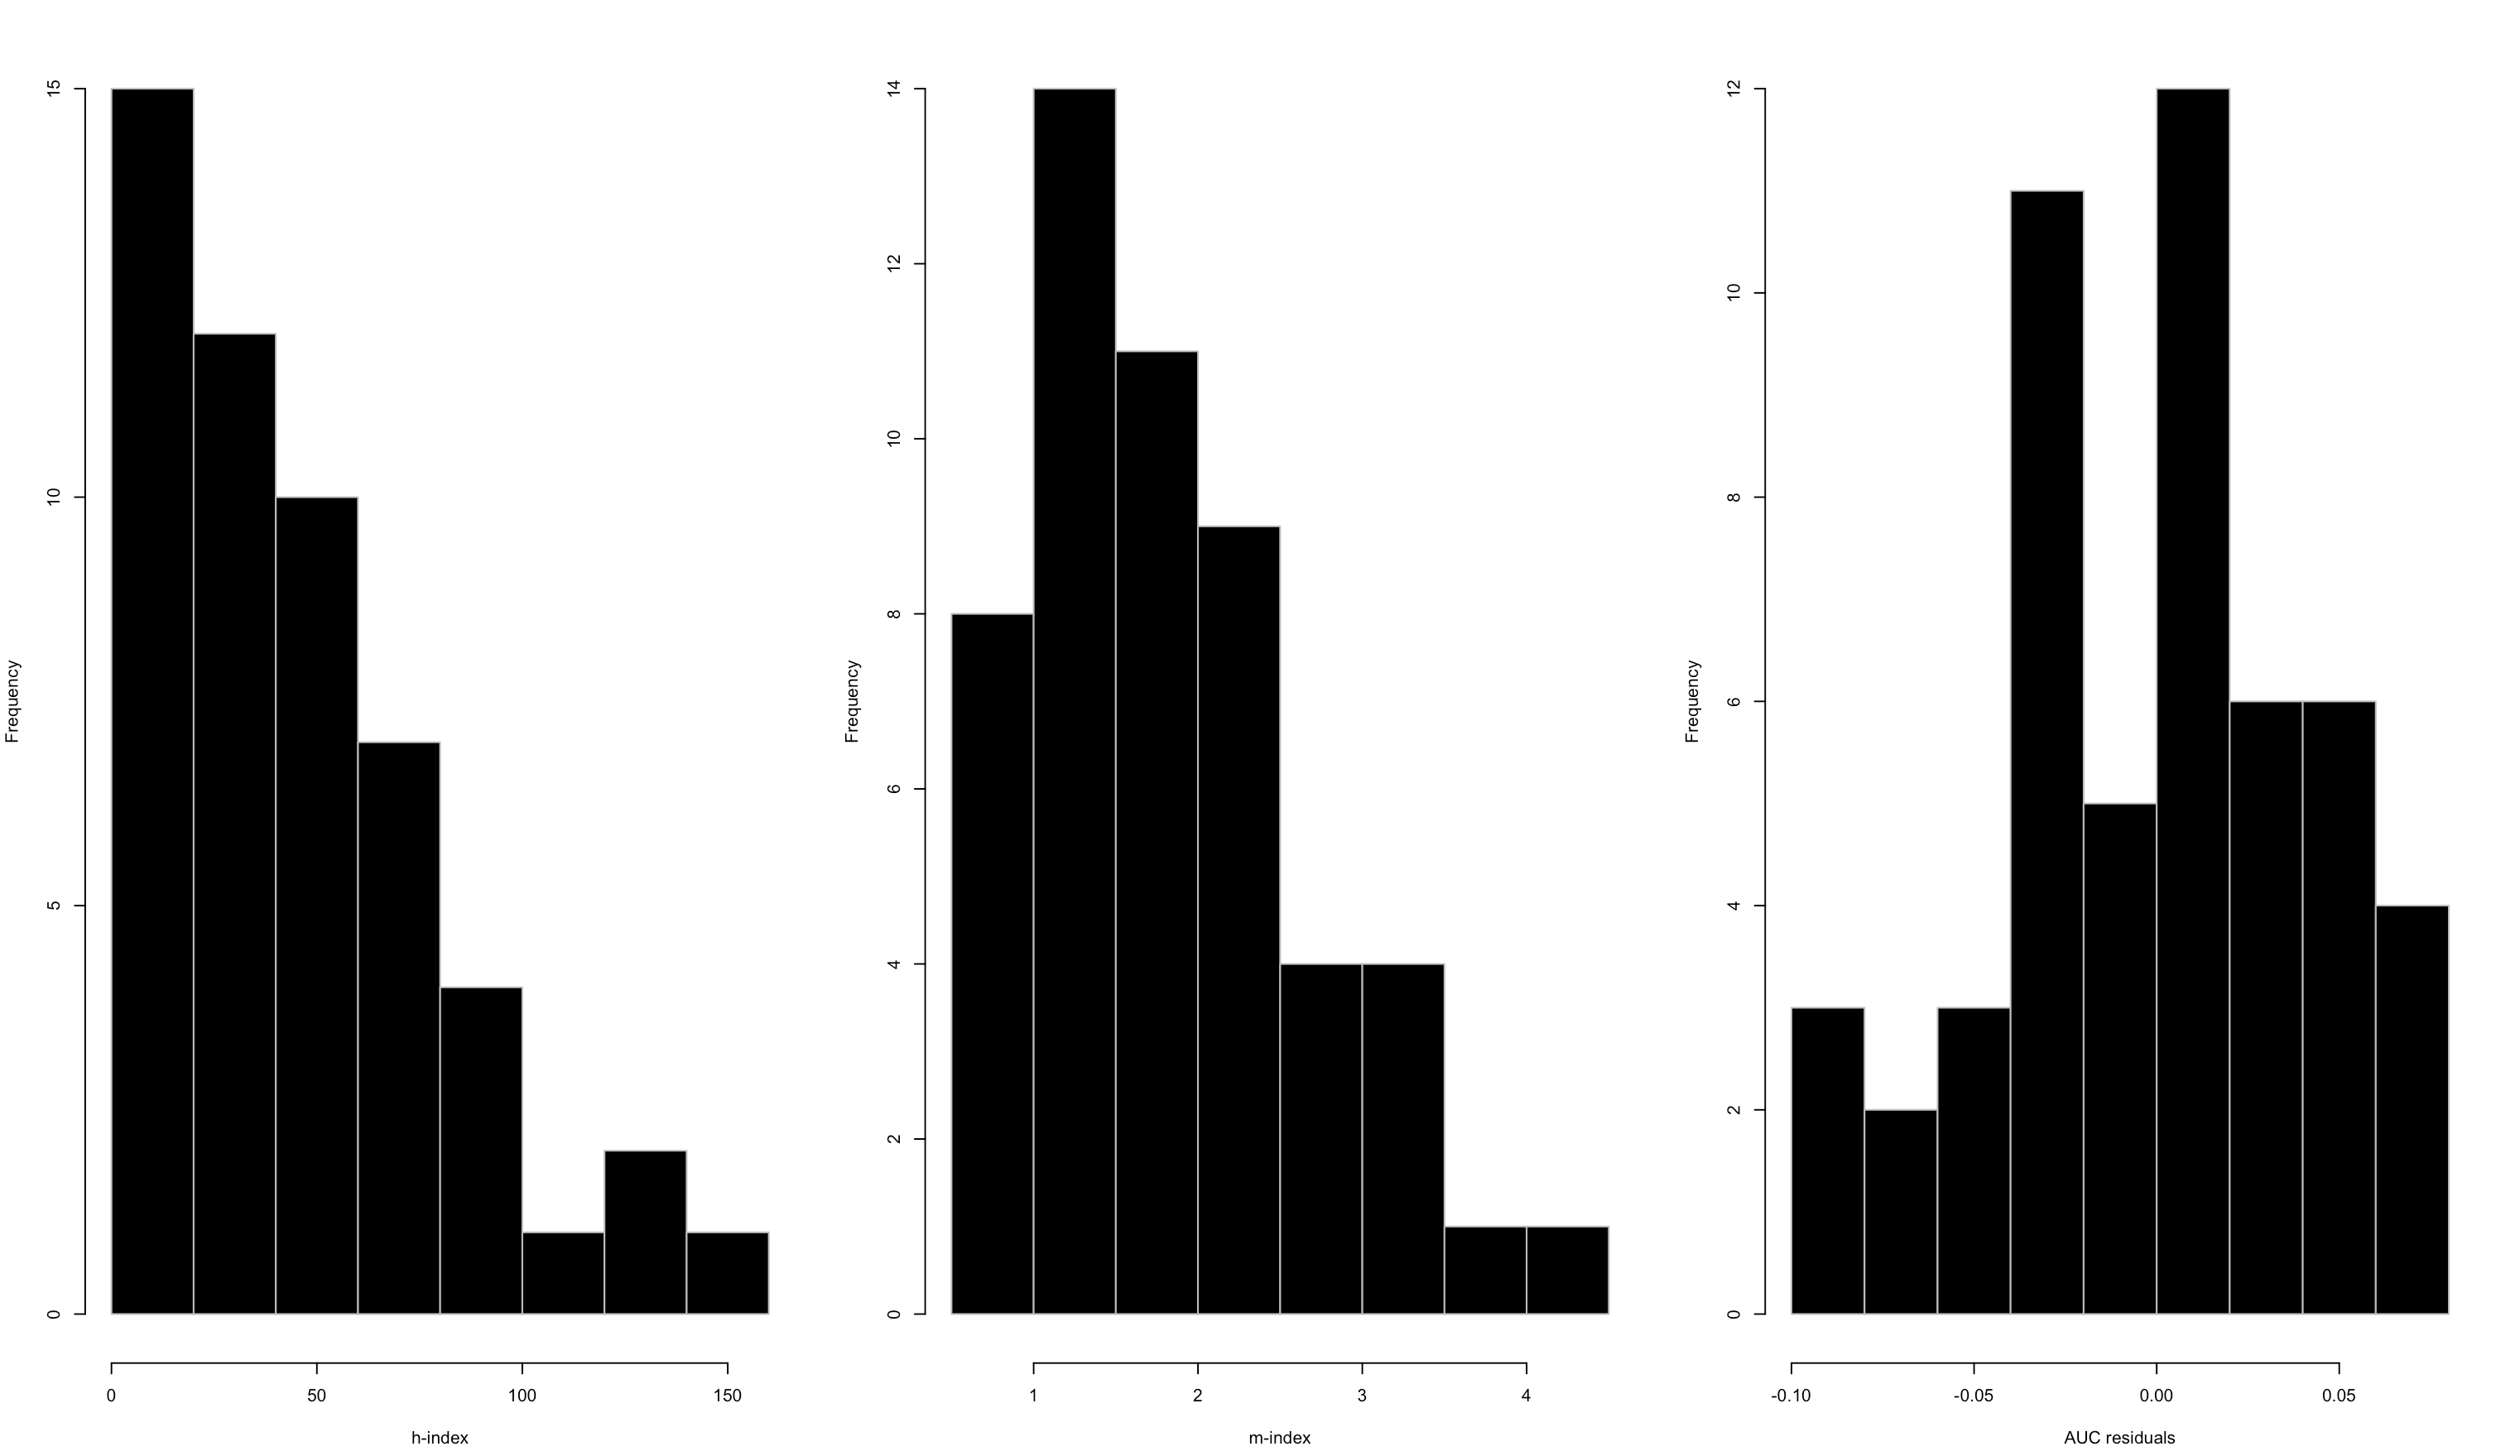
The h-index is highly right-skewed, the m-index is more gamma-distributed, and the AUC residuals are at least a little more well-behaved.
Now, I know some of you are probably asking why not just use the h-index against the log of years since publishing to create the residual ranks (i.e., requiring only 2 values per researcher instead of 4)? Well, I did this too for our sample and plotted the ranks of the AUC method versus the h-index method (again, with women in red and men in black):
![]()
What’s interesting about this is that (i) the ranks are not identical, and (ii) the AUC residuals provides a better rank for women than the h-index residuals (14 women in this sample are better ranked using the AUC residual compared to 9 for the h-index residual). This might be an artefact of the sample, but it could potentially correct for the well-established trend of women having lower h-indices than men on average.
Now, this is a small sample, but it’s probably larger than most samples one might realistically have to rank researchers (recalling the job-application example). Of course, It’s a quick and dirty, first-pass approach to ranking, and so it should never be used in isolation from other indicators. That said, it does assume that there are not too many errors in each researcher’s Google Scholar profile. The approach also has the advantage that career interruptions can be easily taken into account by simply subtracting the non-research-active time from the ‘years since first publication’ values.
If you’re interested, I’ve published the R code and the (anonymised) example dataset on Github.
Have fun, and I hope you find it useful.


[…] in April I blogged about an idea I had to provide a more discipline-, gender-, and career stage-balanced way of […]
LikeLike
Corey, Your approach here entails a number of premises that you might try to defend explicitly. Let me number them:
1) that there is any utility in or justification for looking for a single “best” way of ranking “relative citation performance” (RCP)
2) that any RCP based on combining separate measures introduces a high degree of subjectivity driven by a) the subjective decision as to which measures are selected, and b) the way in which these are always, implicitly or explicitly, weighted relative to each other.
3) that such composite RCPs (CRCPs) can serve serious intellectual or administrative purposes despite this subjectivity and arbitrariness.
4) that the h-index in particular merits serious consideration. I read much of the early literature on this and never found intelligible justification. Consider two persons, A and B, who over the same period of time published three articles each. Respective citation frequencies were 7, 3, and 5 for A ,and 3, 140 and 2700 for B — in what way are these two records equal just because each has an h-index of 3?
5) that it make sense to take C(max) into account but not total no. of citations
6) that there is a clear, logical, quantitative way to try to take age or length of professional life or “career interruptions” into account.
Researchers and pundits can do as they like, of course, but it would be dangerous for any decision-making bodies (e.g. deans, faculty search committees, promotions committees, awards committees, etc.) to make ANY use of a composite measure of citation records. Just as it would be without purpose to get a composite measure of body size by, e.g., taking the geometric mean of height, width and weight. Or to get a composite measure of virtue by combining measures of …… whatever.
One datum that would be of great interest but that is NOT currently available anywhere is the total multiplicity-adjusted citation frequency (MACF) for authors. This would adjust for the number of authors (n) on a paper so that each author was credited with only TC/n citations, where TC = total citations for that paper. There are some fields where n is typically very small (e.g. paleontology, systematics, mathematics, engineering) and others where is is very high (e.g. molecular biology, exoplanets, clinical trials). On top of that, there is large variation just due to the personalities and m.o.s of individual researchers.
Isn’t the conclusion that a multidimensional tabulation is what would be most intelligible and appropriate for any comparison of scientists that might be used in any way for decision-making?
This would allow each viewer of such a tabulation to weigh, subconsciously, each measure according to his/her own lights rather than being confronted with a confusing composite measure based on subjective weightings by others.
A modest set of intelligible measures should be sufficient. I’d suggest:
TC, MACF, 10-index, C(max), years since first peer-reviewed publication and total no. of peer-reviewed publications (though this latter is not always so easily determined).
LikeLike