Journal ranks 2021

4 07 2022

Now that Clarivate, Google, and Scopus have recently published their respective journal citation scores for 2021, I can now present — for the 14th year running on ConvervationBytes.com — the 2021 conservation/ecology/sustainability journal ranks based on my journal-ranking method.

Like last year, I’ve added a few journals. I’ve also included in the ranking the Journal Citation Indicator (JCI) in addition to the Journal Impact Factor and Immediacy Index from Clarivate ISI, and the CiteScore (CS) in addition to the Source-Normalised Impact Per Paper (SNIP) and SCImago Journal Rank (SJR) from Scopus. 

You can access the raw data for 2021 and use my RShiny app to derive your own samples of journal ranks.

I therefore present the new 2021 ranks for: (i) 106 ecology, conservation and multidisciplinary journals, (ii) 27 open-access (i.e., you have to pay) journals from the previous category, (iii) 64 ‘ecology’ journals, (iv) 32 ‘conservation’ journals, (v) 43 ‘sustainability’ journals (with general and energy-focussed journals included), and (vi) 21 ‘marine & freshwater’ journals.

Remember not to take much notice if a journal boasts about how its Impact Factor has increased this year, because these tend to increase over time anyway What’s important is a journal’s relative (to other journals) rank.

Here are the results:

Read the rest of this entry »


Journal ranks 2020

23 07 2021

This is the 13th year in a row that I’ve generated journal ranks based on the journal-ranking method we published several years ago.

There are few differences in how I calculated this year’s ranks, as well as some relevant updates:

  1. As always, I’ve added a few new journals (either those who have only recently been scored with the component metrics, or ones I’ve just missed before);
  2. I’ve included the new ‘Journal Citation Indicator’ (JCI) in addition to the Journal Impact Factor and Immediacy Index from Clarivate ISI. JCI “… a field-normalised metric, represents the average category-normalised citation impact for papers published in the prior three-year period.”. In other words, it’s supposed to correct for field-specific citation trends;
  3. While this isn’t my change, the Clarivate metrics are now calculated based on when an article is first published online, rather than just in an issue. You would have thought that this should have been the case for many years, but they’ve only just done it;
  4. I’ve also added the ‘CiteScore’ (CS) in addition to the Source-Normalised Impact Per Paper (SNIP) and SCImago Journal Rank (SJR) from Scopus. CS is “the number of citations, received in that year and previous 3 years, for documents published in the journal during that period (four years), divided by the total number of published documents … in the journal during the same four-year period”;
  5. Finally, you can access the raw data for 2020 (I’ve done the hard work for you) and use my RShiny app to derive your own samples of journal ranks (also see the relevant blog post). You can add new journal as well to the list if my sample isn’t comprehensive enough for you.

Since the Google Scholar metrics were just released today, I present the new 2020 ranks for: (i) 101 ecology, conservation and multidisciplinary journals, and a subset of (ii) 61 ‘ecology’ journals, (iii) 29 ‘conservation’ journals, (iv) 41 ‘sustainability’ journals (with general and energy-focussed journals included), and (v) 20 ‘marine & freshwater’ journals.

One final observation. I’ve noted that several journals are boasting about how their Impact Factors have increased this year, when they fail to mention that this is the norm across most journals. As you’ll see below, relative ranks don’t actually change that much for most journals. In fact, this is a redacted email I received from a journal that I will not identify here:

We’re pleased to let you know that the new Impact Factor for [JOURNAL NAME] marks a remarkable increase, as it now stands at X.XXX, compared to last year’s X.XXX. And what is even more important: [JOURNAL NAME] increased its rank in the relevant disciplines: [DISCIPLINE NAME].

Although the Impact Factor may not be the perfect indicator of success, it remains the most widely recognised one at journal level. Therefore, we’re excited to share this achievement with you, as it wouldn’t have been possible, had it not been for all of your contributions and support as authors, reviewers, editors and readers. A huge ‘THANK YOU’ goes to all of you!

What bullshit.

Anyway, on to the results:

Read the rest of this entry »


Rank your own sample of journals

29 12 2020

If you follow my blog regularly, you’ll know that around the middle of each year I publish a list of journals in conservation and ecology ranked according to a multi-index algorithm we developed back in 2016. The rank I release coincides with the release of the Web of Knowledge Impact Factors, various Scopus indices, and the Google Scholar journal ranks.

The reasons we developed a multi-index rank are many (summarised here), but they essentially boil down to the following rationale:

(i) No single existing index is without its own faults; (ii) ranks are only really meaningful when expressed on a relative scale; and (iii) different disciplines have wildly different index values, so generally disciplines aren’t easily compared.

That’s why I made the R code available to anyone wishing to reproduce their own ranked sample of journals. However, given that implementing the R code takes a bit of know-how, I decided to apply my new-found addiction to R Shiny to create (yet another) app.

Welcome to the JournalRankShiny app.

This new app takes a pre-defined list of journals and the required indices, and does the resampled ranking for you based on a few input parameters that you can set. It also provides a few nice graphs for the ranks (and their uncertainties), as well as a plot showing the relationship between the resulting ranks and the journal’s Impact Factor (for comparison).

Read the rest of this entry »


Collect and analyse your Altmetric data

17 11 2020

Last week I reported that I had finally delved into the world of R Shiny to create an app that calculates relative citation-based ranks for researchers.

I’m almost slightly embarrassed to say that Shiny was so addictive that I ended up making another app.

This new app takes any list of user-supplied digital object identifiers (doi) and fetches their Altmetric data for you.

Why might you be interested in a paper’s Altmetric data? Citations are only one measure of an article’s impact on the research community, whereas Altmetrics tend to indicate the penetration of the article’s findings to a much broader audience.

Altmetric is probably the leading way to gauge the ‘impact’ (attention) an article has commanded across all online sources, including news articles, tweets, Facebook entries, blogs, Wikipedia mentions and others.

And for those of us interested in influencing policy with our work, Altmetrics also collate citations arising from policy documents.

Read the rest of this entry »


The ε-index app: a fairer way to rank researchers with citation data

9 11 2020

Back in April I blogged about an idea I had to provide a more discipline-, gender-, and career stage-balanced way of ranking researchers using citation data.

Most of you are of course aware of the ubiquitous h-index, and its experience-corrected variant, the m-quotient (h-index ÷ years publishing), but I expect that you haven’t heard of the battery of other citation-based indices on offer that attempt to correct various flaws in the h-index. While many of them are major improvements, almost no one uses them.

Why aren’t they used? Most likely because they aren’t easy to calculate, or require trawling through both open-access and/or subscription-based databases to get the information necessary to calculate them.

Hence, the h-index still rules, despite its many flaws, like under-emphasising a researcher’s entire body of work, gender biases, and weighting towards people who have been at it longer. The h-index is also provided free of charge by Google Scholar, so it’s the easiest metric to default to.

So, how does one correct for at least some of these biases while still being able to calculate an index quickly? I think we have the answer.

Since that blog post back in April, a team of seven scientists and I from eight different science disciplines (archaeology, chemistry, ecology, evolution & development, geology, microbiology, ophthalmology, and palaeontology) refined the technique I reported back then, and have submitted a paper describing how what we call the ‘ε-index’ (epsilon index) performs.

Read the rest of this entry »


Journal ranks 2019

8 07 2020

journalstack_16x9

For the last 12 years and running, I’ve been generating journal ranks based on the journal-ranking method we published several years ago. Since the Google journal h-indices were just released, here are the new 2019 ranks for: (i) 99 ecology, conservation and multidisciplinary journals, and a subset of (ii) 61 ‘ecology’ journals, (iii) 27 ‘conservation’ journals, (iv) 41 ‘sustainability’ journals (with general and energy-focussed journals included), and (v) 20 ‘marine & freshwater’ journals.

See also the previous years’ rankings (2018, 20172016201520142013, 2012, 20112010, 2009, 2008).

Read the rest of this entry »


A fairer way to rank a researcher’s relative citation performance?

23 04 2020

runningI do a lot of grant assessments for various funding agencies, including two years on the Royal Society of New Zealand’s Marsden Fund Panel (Ecology, Evolution, and Behaviour), and currently as an Australian Research Council College Expert (not to mention assessing a heap of other grant applications).

Sometimes this means I have to read hundreds of proposals made up of even more researchers, all of whom I’m meant to assess for their scientific performance over a short period of time (sometimes only within a few weeks). It’s a hard job, and I doubt very much that there’s a completely fair way to rank a researcher’s ‘performance’ quickly and efficiently.

It’s for this reason that I’ve tried to find ways to rank people in the most objective way possible. This of course does not discount reading a person’s full CV and profile, and certainly taking into consideration career breaks, opportunities, and other extenuating circumstances. But I’ve tended to do a first pass based primarily on citation indices, and then adjust those according to the extenuating circumstances.

But the ‘first pass’ part of the equation has always bothered me. We know that different fields have different rates of citation accumulation, that citations accumulate with age (including the much heralded h-index), and that there are gender (and other) biases in citations that aren’t easily corrected.

I’ve generally relied on the ‘m-index’, which is simply one’s h-index divided by the number of years one has been publishing. While this acts as a sort of age correction, it’s still unsatisfactory, essentially because I’ve noticed that it tends to penalise early career researchers in particular. I’ve tried to account for this by comparing people roughly within the same phase of career, but it’s still a subjective exercise.

I’ve recently been playing with an alternative that I think might be a way forward. Bear with me here, for it takes a bit of explaining. Read the rest of this entry »


Does high exposure on social and traditional media lead to more citations?

18 12 2019

social mediaOne of the things that I’ve often wondered about is whether making the effort to spread your scientific article’s message as far and wide as possible on social media actually brings you more citations.

While there’s more than enough justification to promote your work widely for non-academic purposes, there is some doubt as to whether the effort reaps academic awards as well.

Back in 2011 (the Pleistocene of social media in science), Gunther Eysenbach examined 286 articles in the obscure Journal of Medical Internet Research, finding that yes, highly cited papers did indeed have more tweets. But he concluded:

Social media activity either increases citations or reflects the underlying qualities of the article that also predict citations …

Subsequent work has established similar positive relationships between social-media exposure and citation rates (e.g., for 208739 PubMed articles> 10000 blog posts of articles published in > 20 journals), weak relationships (e.g., using 27856 PLoS One articlesbased on 1380143 articles from PubMed in 2013), or none at all (e.g., for 130 papers in International Journal of Public Health).

While the research available suggests that, on average, the more social-media exposure a paper gets, the more likely it is to be cited, the potential confounding problem raised by Eysenbach remains — are interesting papers that command a lot of social-media attention also those that would garner scientific interest anyway? In other words, are popular papers just popular in both realms, meaning that such papers are going to achieve high citation rates anyway?

Read the rest of this entry »


Journal ranks 2018

23 07 2019

journal stacks

As has become my custom (11 years and running), and based on the journal-ranking method we published several years ago, here are the new 2018 ranks for (i) 90 ecology, conservation and multidisciplinary journals, and a subset of (ii) 56 ‘ecology’ journals, and (iii) 26 ‘conservation’ journals. I’ve also included two other categories — (iv) 40 ‘sustainability’ journals (with general and energy-focussed journals included), and 19 ‘marine & freshwater’ journals for the watery types.

See also the previous years’ rankings (20172016201520142013, 2012, 20112010, 2009, 2008).

Read the rest of this entry »


Journal ranks 2017

27 08 2018

book-piles

A few years ago we wrote a bibliometric paper describing a new way to rank journals, and I still think it is one of the better ways to rank them based on a composite index of relative citation-based metrics . I apologise for taking so long to do the analysis this year, but it took Google Scholar a while to post their 2017 data.

So, here are the 2017 ranks for (i) 88 ecology, conservation and multidisciplinary journals, and a subset of (ii) 55 ‘ecology’ journals, (iii) 24 ‘conservation’ journals. Also this year, I’ve included two new categories — (iv) 38 ‘sustainability’ journals (with general and energy-focussed journals included), and 19 ‘marine & freshwater’ journals for you watery types.

See also the previous years’ rankings (2016201520142013, 2012, 20112010, 2009, 2008).

Read the rest of this entry »


When to appeal a rejection

26 08 2017

BegA modified excerpt from my upcoming book for you to contemplate after your next rejection letter.

This is a delicate subject that requires some reflection. Early in my career, I believed the appeal process to be a waste of time. Having made one or two of them to no avail, and then having been on the receiving end of many appeals as a journal editor myself, I thought that it would be a rare occasion indeed when an appeal actually led to a reversal of the final decision.

It turns out that I was very wrong, but not in terms of simple functional probability that you might be thinking. Ironically, the harder it is to get a paper published in a journal, the higher the likelihood that an appeal following rejection will lead to a favourable outcome for the submitting authors. Let me explain. Read the rest of this entry »


Journal ranks 2016

14 07 2017

Many books

Last year we wrote a bibliometric paper describing a new way to rank journals, which I contend is a fairer representation of relative citation-based rankings by combining existing ones (e.g., ISI, Google Scholar and Scopus) into a composite rank. So, here are the 2016 ranks for (i) 93 ecology, conservation and multidisciplinary journals, and a subset of (ii) 46 ecology journals, (iii) 21 conservation journals, just as I have done in previous years (201520142013, 2012, 20112010, 2009, 2008).

Read the rest of this entry »


Journal ranks 2015

26 07 2016

graduate_barsBack in February I wrote about our new bibliometric paper describing a new way to rank journals, which I still contend is a fairer representation of relative citation-based rankings. Given that the technique requires ISI, Google Scholar and Scopus data to calculate the composite ranks, I had to wait for the last straggler (Google) to publish the 2015 values before I could present this year’s rankings to you. Google has finally done that.

So in what has become a bit of an annual tradition, I’m publishing the ranks of a mixed list of ecology, conservation and multidisciplinary disciplines that probably cover most of the journals you might be interested in comparing. Like for last year, I make no claims that this list is comprehensive or representative. For previous lists based on ISI Impact Factors (except 2014), see the following links (2008, 2009, 2010, 2011, 2012, 2013).

So here are the following rankings of (i) 84 ecology, conservation and multidisciplinary journals, and a subset of (ii) 42 ecology journals, (iii) 21 conservation journals, and (iv) 12 marine and freshwater journals. Read the rest of this entry »


How to rank journals

18 02 2016

ranking… properly, or at least ‘better’.

In the past I have provided ranked lists of journals in conservation ecology according to their ISI® Impact Factor (see lists for 2008, 2009, 2010, 2011, 2012 & 2013). These lists have proven to be exceedingly popular.

Why are journal metrics and the rankings they imply so in-demand? Despite many people loathing the entire concept of citation-based journal metrics, we scientists, our administrators, granting agencies, award committees and promotion panellists use them with such merciless frequency that our academic fates are intimately bound to the ‘quality’ of the journals in which we publish.

Human beings love to rank themselves and others, the things they make, and the institutions to which they belong, so it’s a natural expectation that scientific journals are ranked as well.

I’m certainly not the first to suggest that journal quality cannot be fully captured by some formulation of the number of citations its papers receive; ‘quality’ is an elusive characteristic that includes inter alia things like speed of publication, fairness of the review process, prevalence of gate-keeping, reputation of the editors, writing style, within-discipline reputation, longevity, cost, specialisation, open-access options and even its ‘look’.

It would be impossible to include all of these aspects into a single ‘quality’ metric, although one could conceivably rank journals according to one or several of those features. ‘Reputation’ is perhaps the most quantitative characteristic when measured as citations, so we academics have chosen the lowest-hanging fruit and built our quality-ranking universe around them, for better or worse.

I was never really satisfied with metrics like black-box Impact Factors, so when I started discovering other ways to express the citation performance of the journals to which I regularly submit papers, I became a little more interested in the field of bibliometrics.

In 2014 I wrote a post about what I thought was a fairer way to judge peer-reviewed journal ‘quality’ than the default option of relying solely on ISI® Impact Factors. I was particularly interested in why the new kid on the block — Google Scholar Metrics — gave at times rather wildly different ranks of the journals in which I was interested.

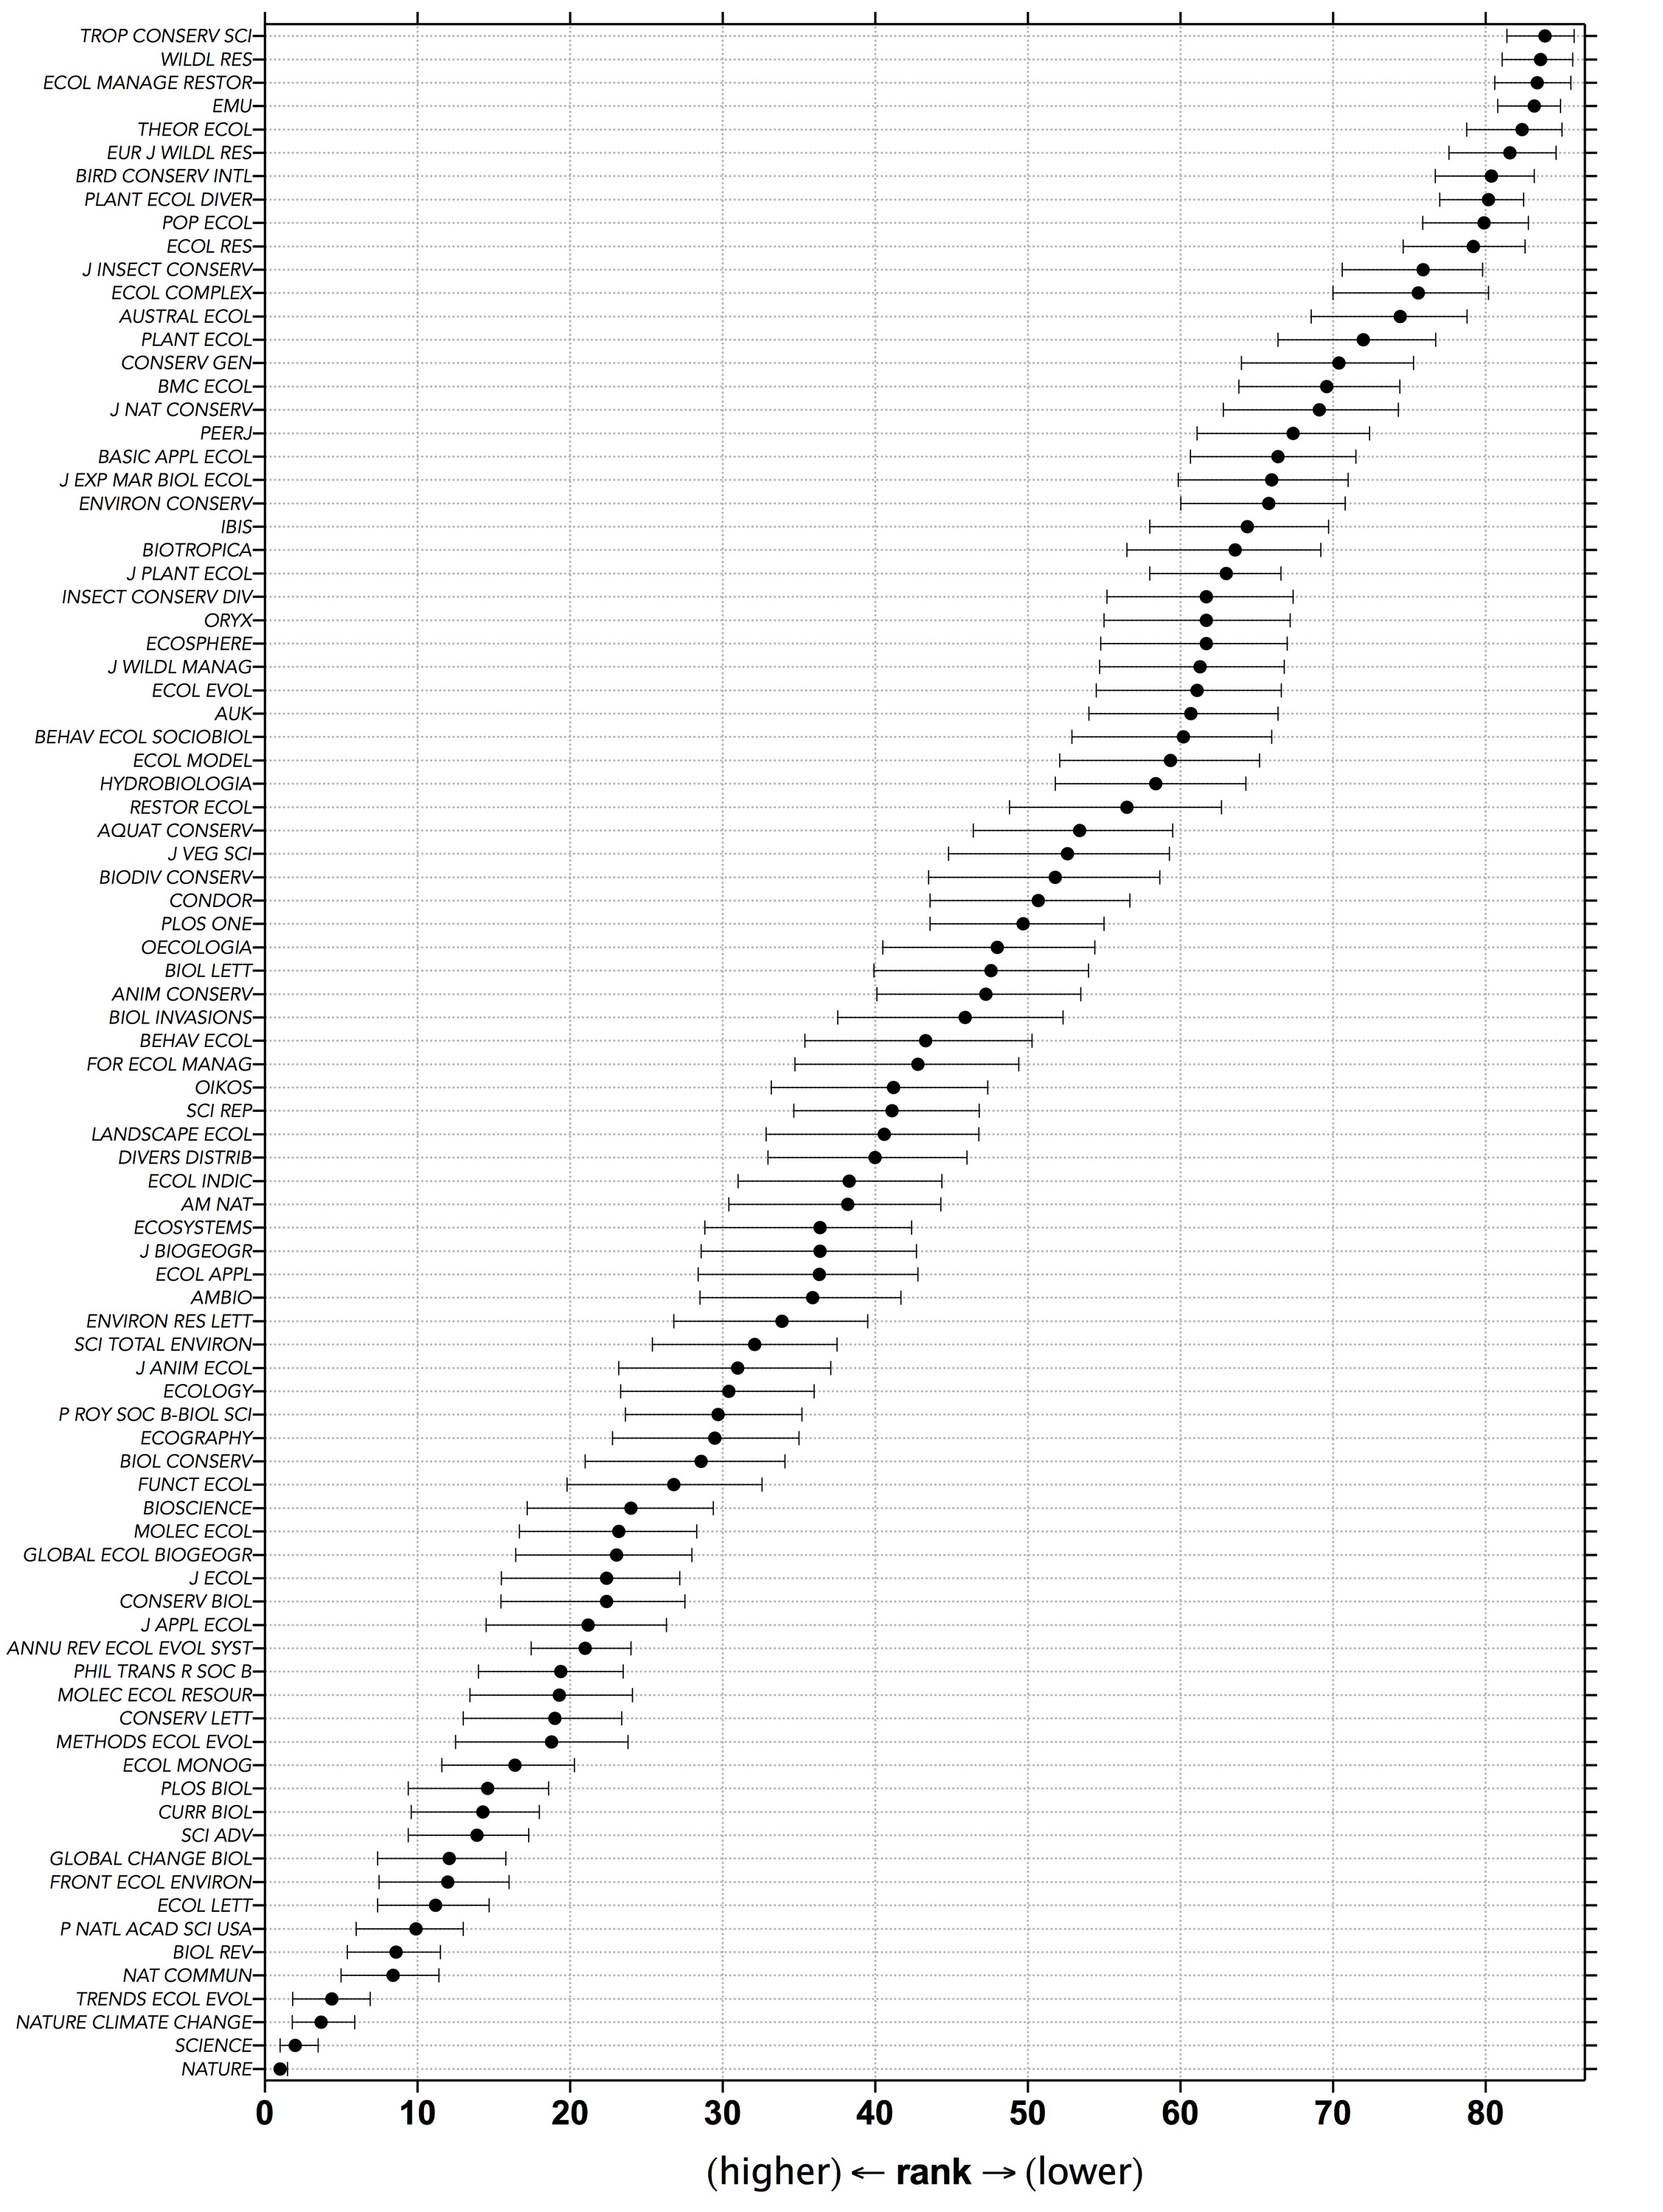
So I came up with a simple mean ranking method to get some idea of the relative citation-based ‘quality’ of these journals.

It was a bit of a laugh, really, but my long-time collaborator, Barry Brook, suggested that I formalise the approach and include a wider array of citation-based metrics in the mean ranks.

Because Barry’s ideas are usually rather good, I followed his advice and together we constructed a more comprehensive, although still decidedly simple, approach to estimate the relative ranks of journals from any selection one would care to cobble together. In this case, however, we also included a rank-placement resampler to estimate the uncertainty associated with each rank.

I’m pleased to announce that the final version1 is now published in PLoS One2. Read the rest of this entry »


Scientists should blog

27 05 2014

© Bill Porter

© Bill Porter

As ConservationBytes.com is about to tick over 1 million hits since its inception in mid-2008, I thought I’d share why I think more scientists should blog about their work and interests.

As many of you know, I regularly give talks and short courses on the value of social and other media for scientists; in fact, my next planned ‘workshop’ (Make Your Science Matter) on this and related subjects will be held at the Ecological Society of Australia‘s Annual Conference in Alice Springs later this year.

I’ve written before about the importance of having a vibrant, attractive and up-to-date online profile (along with plenty of other tips), but I don’t think I’ve ever put down my thoughts on blogging in particular. So here goes.

  1. The main reasons scientists should consider blogging is the hard, cold fact that not nearly enough people read scientific papers. Most scientists are lucky if a few of their papers ever top 100 citations, and I’d wager that most are read by only a handful of specialists (there are exceptions, of course, but these are rare). If you’re a scientist, I don’t have to tell you the disappointment of realising that the blood, sweat and tears shed over each and every paper is largely for nought considering just how few people will ever read our hard-won results. It’s simply too depressing to contemplate, especially considering that the sum of human knowledge is so vast and expanding that this trend will only ever get worse. For those reasons alone, blogging about your own work widens the readership by orders of magnitude. More people read my blog every day than will probably ever read the majority of my papers. Read the rest of this entry »


A posthumous citation tribute for Sodhi

6 11 2012

I’m sitting at a friend’s house in Sydney writing this quick entry before jumping on a plane to London. It’s been a busy few days, and will be an even busier next few weeks.

I met with Paul and Anne Ehrlich yesterday (who are visiting Australia) and we finalised the first complete draft of our book – I will keep you posted on that. In London, I will be meeting with the Journal of Animal Ecology crew on Wednesday night (I’m on the editorial board), followed by two very interesting days at the Zoological Society of London‘s Protected Areas Symposium at Regent’s Park. Then I’ll be off to the Universities of Liverpool and York for a quick lecture tour, followed by a very long trip back home. I’m already tired.

In the meantime, I thought I’d share a little bit of news about our dear and recently deceased friend and colleague, Navjot Sodhi. We’ve already written several times our personal tributes (see here, here and here) to this great mind of conservation thinking who disappeared from us far too soon, but this is a little different. Barry Brook, as is his wont to do, came up with a great idea to get Navjot up posthumously on Google Scholar.
Read the rest of this entry »


Conservation Letters citation statistics

15 07 2010

As most CB readers will know, the ‘new’ (as of 2008) conservation journal kid on the block that I co-edit, Conservation Letters, was ISI-listed this year. This allows us to examine our citation statistics and make some informed guesses about the journal’s Impact Factor that should be ascribed next year. Here are some stats:

  • We published 31 articles in 5 issues in 2008, 37 articles in 6 issues in 2009, and so far 24 articles in 3 issues in 2010
  • Most authors were from the USA (53), followed by Australia (28), UK (29), Canada (10), France (7) and South Africa (4)
  • The published articles have received a total of 248 citations, with an average citation rate per article of 2.70
  • The journal’s h-index = 8 (8 articles have been cited at least 8 times)
  • The 31 articles published in 2008 have received thus far 180 citations (average of 5.81 citations per article)
  • The top 10 most cited articles are (in descending order): Read the rest of this entry »