Dangers of forcing regressions through the origin

17 10 2017

correlationsI had an interesting ‘discussion’ on Twitter yesterday that convinced me the topic would make a useful post. The specific example has nothing whatsoever to do with conservation, but it serves as a valuable statistical lesson for all concerned about demonstrating adequate evidence before jumping to conclusions.

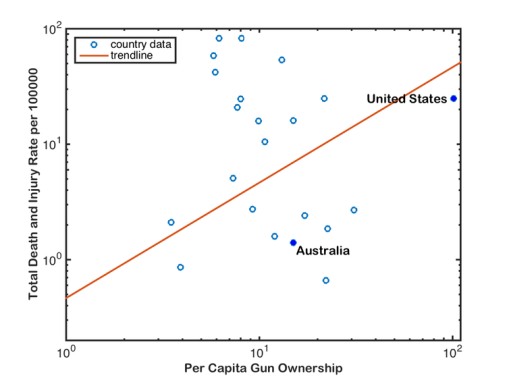
The data in question were used in a correlation between national gun ownership (guns per capita) and gun-related deaths and injuries (total deaths and injuries from guns per 100,000 people) (the third figure in the article). As you might intuitively expect, the author concluded that there was a positive correlation between gun-related deaths and injuries, and gun ownership:

image-20160307-30436-2rzo6k

__

Now, if you’re an empirical skeptic like me, there was something fishy about that fitted trend line. So, I replotted the data (available here) using Plot Digitizer (if you haven’t yet discovered this wonderful tool for lifting data out of figures, you would be wise to get it now), and ran a little analysis of my own in R:

Rplot01

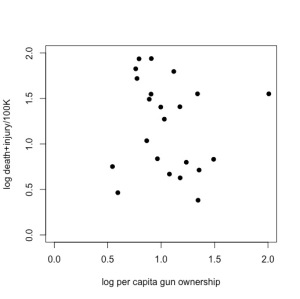
Just doing a little 2-parameter linear model (y ~ α + βx) in R on these log-log data (which means, it’s assumed to be a power relationship), shows that there’s no relationship at all — the intercept is 1.3565 (± 0.3814) in log space (i.e., 101.3565 = 22.72), and there’s no evidence for a non-zero slope (in fact, the estimated slope is negative at -0.1411, but it has no support). See R code here.

Now, the author pointed out what appears to be a rather intuitive requirement for this analysis — you should not have a positive number of gun-related deaths/injuries if there are no guns in the population; in other words, the relationship should be forced to go through the origin (xy = 0, 0). You can easily do this in R by using the lm function and setting the relationship to y ~ 0 + x; see code here). Read the rest of this entry »


Software tools for conservation biologists

8 04 2013

computer-programmingGiven the popularity of certain prescriptive posts on ConservationBytes.com, I thought it prudent to compile a list of software that my lab and I have found particularly useful over the years. This list is not meant to be comprehensive, but it will give you a taste for what’s out there. I don’t list the plethora of conservation genetics software that is available (generally given my lack of experience with it), but if this is your chosen area, I’d suggest starting with Dick Frankham‘s excellent book, An Introduction to Conservation Genetics.

1. R: If you haven’t yet loaded the open-source R programming language on your machine, do it now. It is the single-most-useful bit of statistical and programming software available to anyone anywhere in the sciences. Don’t worry if you’re not a fully fledged programmer – there are now enough people using and developing sophisticated ‘libraries’ (packages of functions) that there’s pretty much an application for everything these days. We tend to use R to the exclusion of almost any other statistical software because it makes you learn the technique rather than just blindly pressing the ‘go’ button. You could also stop right here – with R, you can do pretty much everything else that the software listed below does; however, you have to be an exceedingly clever programmer and have a lot of spare time. R can also sometimes get bogged down with too much filled RAM, in which case other, compiled languages such as PYTHON and C# are useful.

2. VORTEX/OUTBREAK/META-MODEL MANAGER, etc.: This suite of individual-based projection software was designed by Bob Lacy & Phil Miller initially to determine the viability of small (usually captive) populations. The original VORTEX has grown into a multi-purpose, powerful and sophisticated population viability analysis package that now links to its cousin applications like OUTBREAK (the only off-the-shelf epidemiological software in existence) via the ‘command centre’ META-MODEL MANAGER (see an examples here and here from our lab). There are other add-ons that make almost any population projection and hindcasting application possible. And it’s all free! (warning: currently unavailable for Mac, although I’ve been pestering Bob to do a Mac version).

3. RAMAS: RAMAS is the go-to application for spatial population modelling. Developed by the extremely clever Resit Akçakaya, this is one of the only tools that incorporates spatial meta-population aspects with formal, cohort-based demographic models. It’s also very useful in a climate-change context when you have projections of changing habitat suitability as the base layer onto which meta-population dynamics can be modelled. It’s not free, but it’s worth purchasing. Read the rest of this entry »