Greater death rates for invasive rabbits from interacting diseases

30 05 2018

When it comes to death rates for invasive European rabbits (Oryctolagus cuniculus) in Australia, it appears that 1 + 1 = 2.1.

Pt tagged rab with RHD+myxo 1 10-08

Tagged European rabbit kitten infected with myxoma virus, but that died from rabbit haemorrhagic virus disease (RHDV). Photo by David Peacock, Biosecurity South Australia.

“Canberra, we have a problem” — Sure, it’s an old problem and much less of one than it used to be back in the 1950s, but invasive rabbits are nonetheless an ecological, conservation, and financial catastrophe across Australia.

relative rabbit abundance South Australia

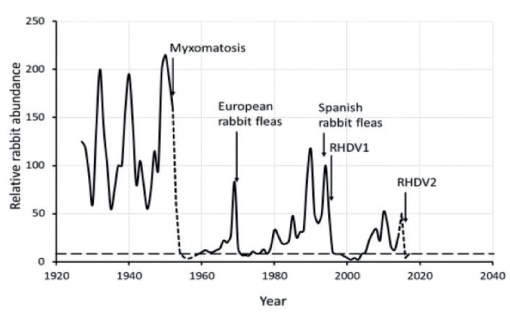
Semi-schematic diagram, redrawn using data from Saunders and others and extended to include the recent spread of RHDV2, showing changes in rabbit abundance in relation to the introduction of biological control agents into north-eastern South Australia. Dotted lines indicate uncertainty due to lack of continuous annual data. The broken line indicates a level of about 0.5 rabbits ha-1, below which rabbits must be held to ensure recovery of native pastures and shrubs (from B. Cooke 2018 Vet Rec doi:10.1136/vr.k2105)

Rabbits used to reach plague numbers in much of agricultural and outback Australia, but the introduction and clever manipulation of two rather effective rabbit-specific viruses and insect vectors — first, myxoma virus in 1950, European rabbit fleas in the 1960s to help spread the virus, then Spanish rabbit fleas in the 1990s to increase spread into arid areas, and then rabbit haemorrhagic disease virus (RHDV) in 1995 — have been effective in dropping rabbit abundances by an estimated 75-80% in South Australia alone since the 1950s.

Read the rest of this entry »


Software tools for conservation biologists

8 04 2013

computer-programmingGiven the popularity of certain prescriptive posts on ConservationBytes.com, I thought it prudent to compile a list of software that my lab and I have found particularly useful over the years. This list is not meant to be comprehensive, but it will give you a taste for what’s out there. I don’t list the plethora of conservation genetics software that is available (generally given my lack of experience with it), but if this is your chosen area, I’d suggest starting with Dick Frankham‘s excellent book, An Introduction to Conservation Genetics.

1. R: If you haven’t yet loaded the open-source R programming language on your machine, do it now. It is the single-most-useful bit of statistical and programming software available to anyone anywhere in the sciences. Don’t worry if you’re not a fully fledged programmer – there are now enough people using and developing sophisticated ‘libraries’ (packages of functions) that there’s pretty much an application for everything these days. We tend to use R to the exclusion of almost any other statistical software because it makes you learn the technique rather than just blindly pressing the ‘go’ button. You could also stop right here – with R, you can do pretty much everything else that the software listed below does; however, you have to be an exceedingly clever programmer and have a lot of spare time. R can also sometimes get bogged down with too much filled RAM, in which case other, compiled languages such as PYTHON and C# are useful.

2. VORTEX/OUTBREAK/META-MODEL MANAGER, etc.: This suite of individual-based projection software was designed by Bob Lacy & Phil Miller initially to determine the viability of small (usually captive) populations. The original VORTEX has grown into a multi-purpose, powerful and sophisticated population viability analysis package that now links to its cousin applications like OUTBREAK (the only off-the-shelf epidemiological software in existence) via the ‘command centre’ META-MODEL MANAGER (see an examples here and here from our lab). There are other add-ons that make almost any population projection and hindcasting application possible. And it’s all free! (warning: currently unavailable for Mac, although I’ve been pestering Bob to do a Mac version).

3. RAMAS: RAMAS is the go-to application for spatial population modelling. Developed by the extremely clever Resit Akçakaya, this is one of the only tools that incorporates spatial meta-population aspects with formal, cohort-based demographic models. It’s also very useful in a climate-change context when you have projections of changing habitat suitability as the base layer onto which meta-population dynamics can be modelled. It’s not free, but it’s worth purchasing. Read the rest of this entry »


%d bloggers like this: