Flooding in the Murray-Darling Basin is creating ideal breeding conditions for many native species that have evolved to take advantage of temporary flood conditions. Led by PhD candidate Rupert Mathwin, our team developed virtual models of the Murray River to reveal a crucial link between natural flooding and the extinction risk of endangered southern bell frogs (Litoria raniformis; also known as growling grass frogs).
Southern bell frogs are one of Australia’s 100 Priority Threatened Species. This endangered frog breeds during spring and summer when water levels increase in their wetlands. However, the natural flooding patterns in Australia’s largest river system have been negatively impacted by expansive river regulation that some years, sees up to 60% of river water extracted for human use.
Our latest paper describes how we built computer simulations of Murray-Darling Basin wetlands filled with simulated southern bell frogs. By changing the simulation from natural to regulated conditions, we showed that modern conditions dramatically increase the extinction risk of these beloved frogs.
The data clearly indicate that successive dry years raise the probability of local extinction, and these effects are strongest in smaller wetlands. Larger wetlands and those with more frequent inundation are less prone to these effects, although they are not immune to them entirely. The models present a warning — we have greatly modified the way the river behaves, and the modern river cannot support the long-term survival of southern bell frogs.’
As someone who writes a lot of models — many for applied questions in conservation management (e.g., harvest quotas, eradication targets, minimum viable population sizes, etc.), and supervises people writing even more of them, I’ve had many different experiences with their uptake and implementation by management authorities.
Some of those experiences have involved catastrophic failures to influence any management or policy. One particularly painful memory relates to a model we wrote to assist with optimising approaches to eradicate (or at least, reduce the densities of) feral animals in Kakadu National Park. We even wrote the bloody thing in Visual Basic (horrible coding language) so people could run the module in Excel. As far as I’m aware, no one ever used it.
Others have been accepted more readily, such as a shark-harvest model, which (I think, but have no evidence to support) has been used to justify fishing quotas, and one we’ve done recently for the eradication of feral pigs on Kangaroo Island (as yet unpublished) has led directly to increased funding to the agency responsible for the programme.
According to Altmetrics (and the online tool I developed to get paper-level Altmetric information quickly), only 3 of the 16 of what I’d call my most ‘applied modelling’ papers have been cited in policy documents:
For many years I’ve been interested in modelling the extinction dynamics of megafauna. Apart from co-authoring a few demographically simplified (or largely demographically free) models about how megafauna species could have gone extinct, I have never really tried to capture the full nuances of long-extinct species within a fully structured demographic framework.
That is, until now.
But how do you get the life-history data of an extinct animal that was never directly measured. Surely, things like survival, reproductive output, longevity and even environmental carrying capacity are impossible to discern, and aren’t these necessary for a stage-structured demographic model?
The answer to the first part of that question “it’s possible”, and to the second, it’s “yes”. The most important bit of information we palaeo modellers need to construct something that’s ecologically plausible for an extinct species is an estimate of body mass. Thankfully, palaeontologists are very good at estimating the mass of the things they dig up (with the associated caveats, of course). From such estimates, we can reconstruct everything from equilibrium densities, maximum rate of population growth, age at first breeding, and longevity.
But it’s more complicated than that, of course. In Australia anyway, we’re largely dealing with marsupials (and some monotremes), and they have a rather different life-history mode than most placentals. We therefore have to ‘correct’ the life-history estimates derived from living placental species. Thankfully, evolutionary biologists and ecologists have ways to do that too.
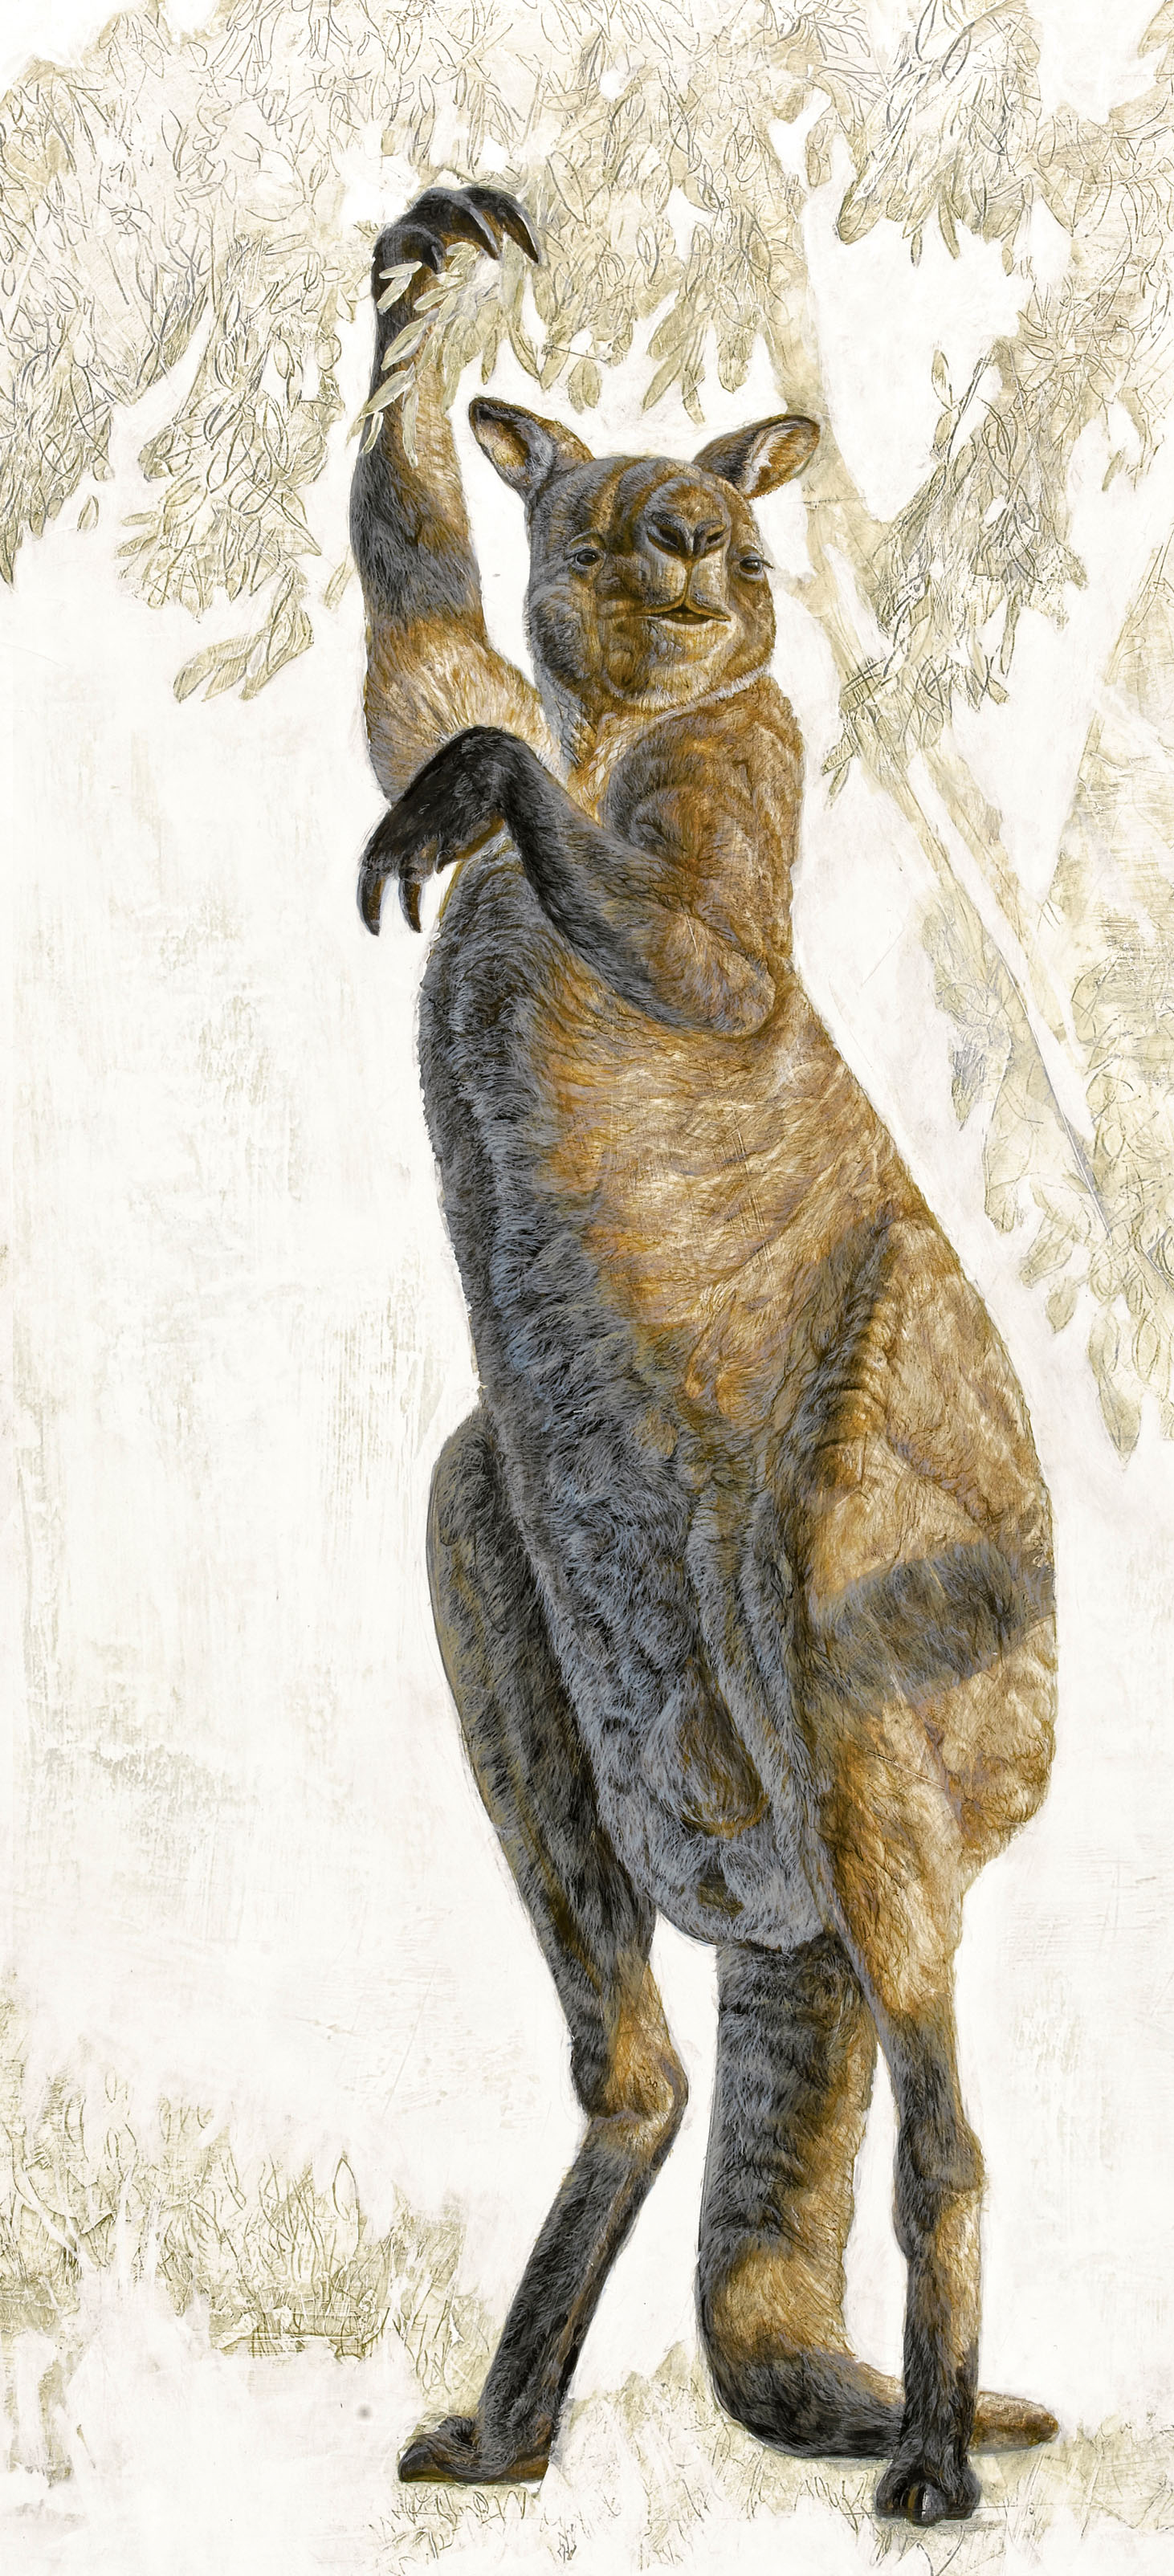
The Pleistocene kangaroo Procoptodon goliah, the largest and most heavily built of the short-faced kangaroos, was the largest and most heavily built kangaroo known. It had an unusually short, flat face and forwardly directed eyes, with a single large toe on each foot (reduced from the more normal count of four). Each forelimb had two long, clawed fingers that would have been used to bring leafy branches within reach.
So with a battery of ecological, demographic, and evolutionary tools, we can now create reasonable stochastic-demographic models for long-gone species, like wombat-like creatures as big as cars, birds more than two metres tall, and lizards more than seven metres long that once roamed the Australian continent.
Ancient clues, in the shape of fossils and archaeological evidence of varying quality scattered across Australia, have formed the basis of several hypotheses about the fate of megafauna that vanished during a peak about 42,000 years ago from the ancient continent of Sahul, comprising mainland Australia, Tasmania, New Guinea and neighbouring islands.
There is a growing consensus that multiple factors were at play, including climate change, the impact of people on the environment, and access to freshwater sources.
Just published in the open-access journal eLife, our latest CABAH paper applies these approaches to assess how susceptible different species were to extinction – and what it means for the survival of species today.
Using various characteristics such as body size, weight, lifespan, survival rate, and fertility, we (Chris Johnson, John Llewelyn, Vera Weisbecker, Giovanni Strona, Frédérik Saltré & me) created population simulation models to predict the likelihood of these species surviving under different types of environmental disturbance.
We compared the results to what we know about the timing of extinction for different megafauna species derived from dated fossil records. We expected to confirm that the most extinction-prone species were the first species to go extinct – but that wasn’t necessarily the case.
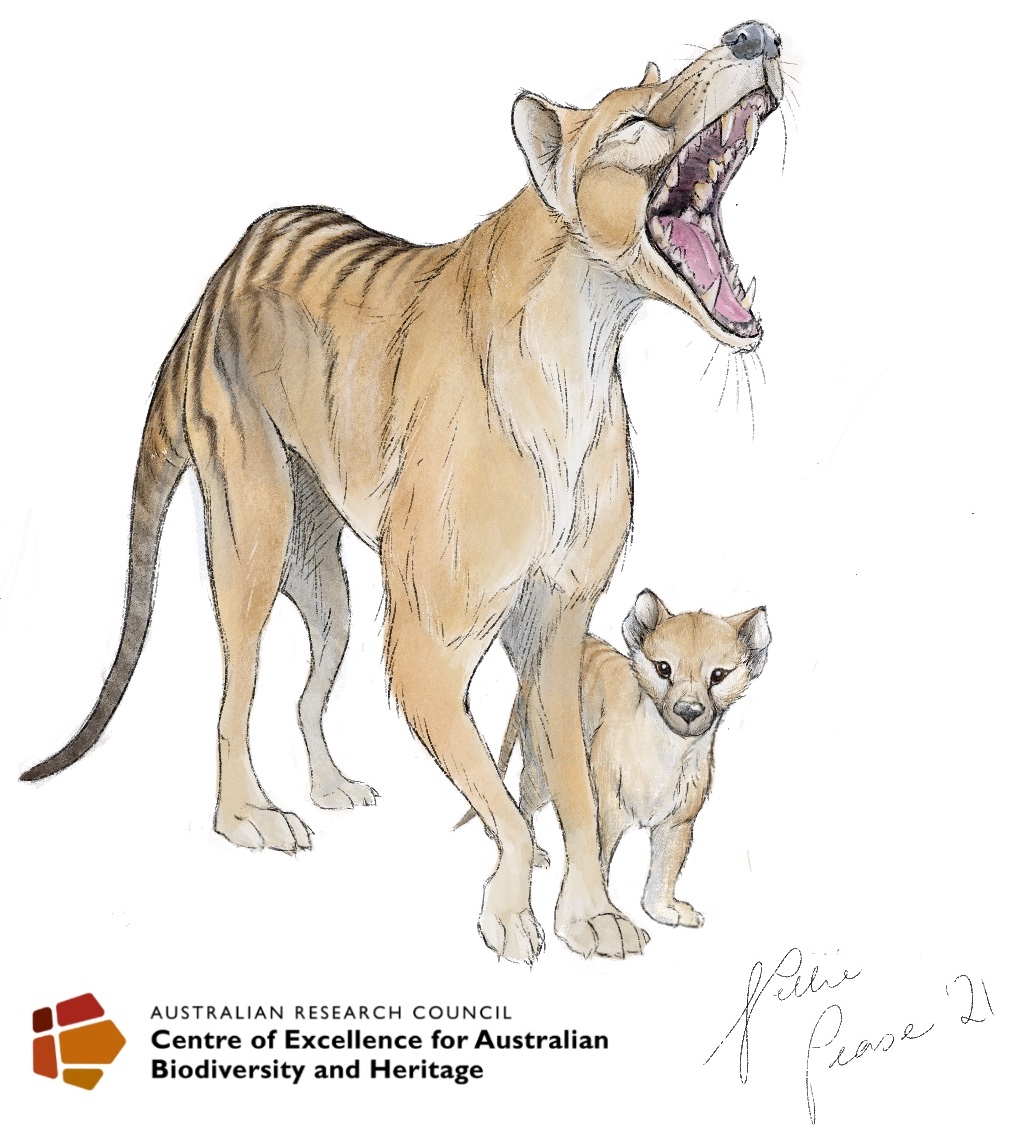
While we did find that slower-growing species with lower fertility, like the rhino-sized wombat relative Diprotodon, were generally more susceptible to extinction than more-fecund species like the marsupial ‘tiger’ thylacine, the relative susceptibility rank across species did not match the timing of their extinctions recorded in the fossil record.
Indeed, we found no clear relationship between a species’ inherent vulnerability to extinction — such as being slower and heavier and/or slower to reproduce — and the timing of its extinction in the fossil record.
In fact, we found that most of the living species used for comparison — such as short-beaked echidnas, emus, brush turkeys, and common wombats — were more susceptible on average than their now-extinct counterparts.
I published this last week on The Conversation, and now reproducing it here for CB.com readers.
—
Two days ago, the last male northern white rhino (Ceratotherium simum cottoni) died. His passing leaves two surviving members of his subspecies: both females who are unable to bear calves.
Even though it might not be quite the end of the northern white rhino because of the possibility of implanting frozen embryos in their southern cousins (C. simum simum), in practical terms, it nevertheless represents the end of a long decline for the subspecies. It also raises the question: how many individuals does a species need to persist?
Fiction writers have enthusiastically embraced this question, most often in the post-apocalypsegenre. It’s a notion with a long past; the Adam and Eve myth is of course based on a single breeding pair populating the entire world, as is the case described in the Ragnarok, the final battle of the gods in Norse mythology.
This idea dovetails neatly with the image of Noah’s animals marching “two by two” into the Ark. But the science of “minimum viable populations” tells us a different story.
While I’m in transit (yet a-bloody-gain) to Helsinki, I wanted to take this opportunity to reflect on one of the most inspiring eco-tourism experiences I recently had in South Australia.
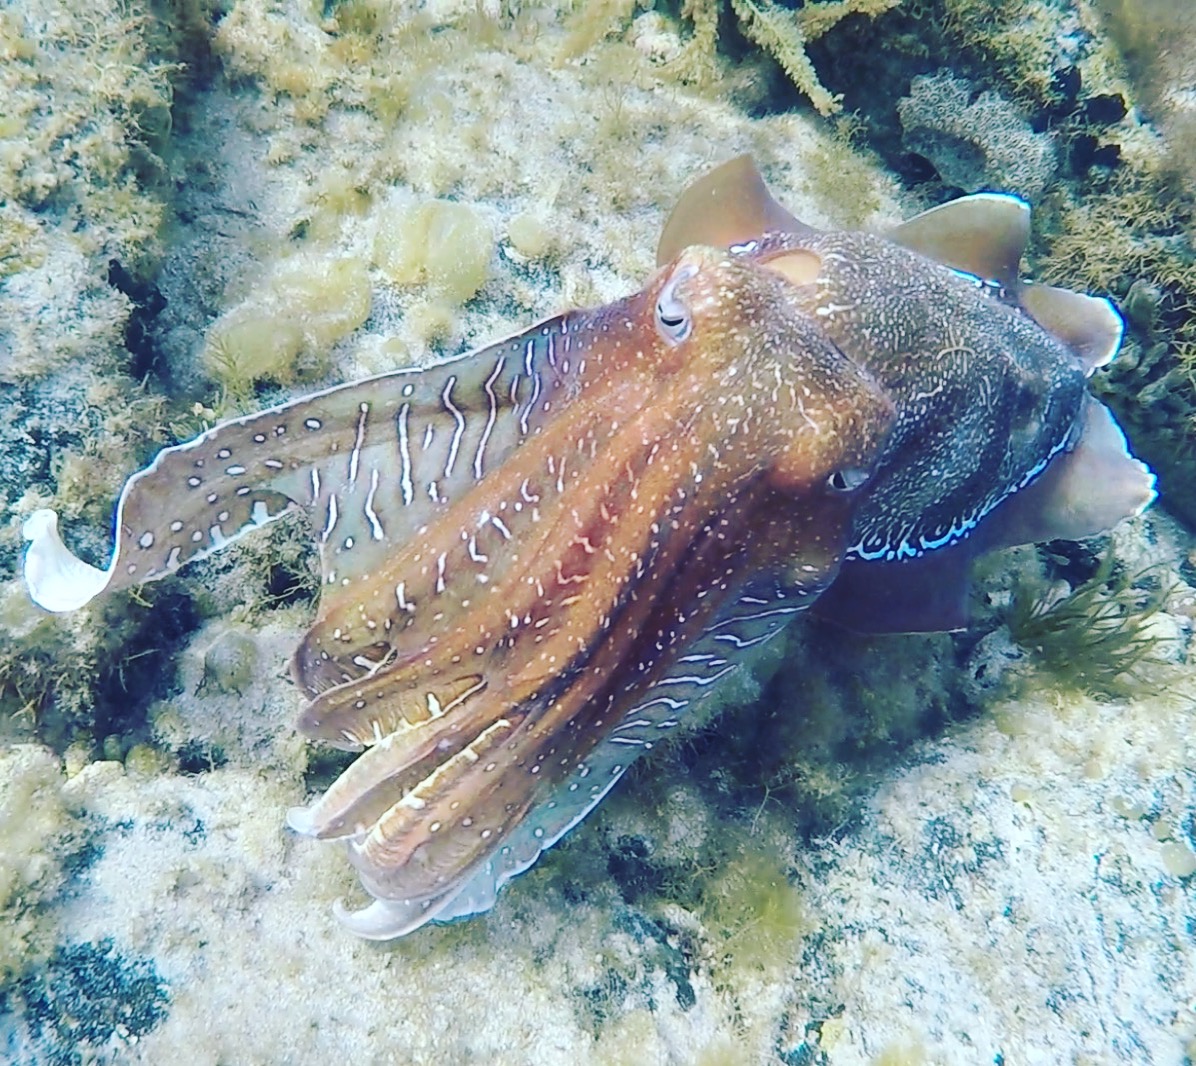
If you are South Australian and have even the slightest interest in wildlife, you will have of course at least heard of the awe-inspiring mass breeding aggregation of giant cuttlefish (Sepia apama) that occur in May-July every year in upper Spencer Gulf near the small town of Whyalla. If you have been lucky enough to go there and see these amazing creatures themselves, then you know exactly what I’m talking about. And if you haven’t yet been there, take it from me that it is so very much worth it to attempt the voyage.
Despite having lived in South Australia for nearly a decade now, I only got my chance to see these wonderful creatures when a father at my daughter’s school organised a school trip. After driving for five hours from Adelaide to Whyalla, we hired our snorkelling gear and got into the water the very next morning. Read the rest of this entry »
You couldn’t really do ecology if you didn’t know how to construct even the most basic mathematical model — even a simple regression is a model (the non-random relationship of some variable to another). The good thing about even these simple models is that it is fairly straightforward to interpret the ‘strength’ of the relationship, in other words, how much variation in one thing can be explained by variation in another. Provided the relationship is real (not random), and provided there is at least some indirect causation implied (i.e., it is not just a spurious coincidence), then there are many simple statistics that quantify this strength — in the case of our simple regression, the coefficient of determination (R2) statistic is a usually a good approximation of this.
When you go beyond this correlative model approach and start constructing more mechanistic models that emulate ecological phenomena from the bottom-up, things get a little more complicated when it comes to quantifying the strength of relationships. Perhaps the most well-known category of such mechanistic models is the humble population viability analysis, abbreviated to PVA§.
Let’s take the simple case of a four-parameter population model we could use to project population size over the next 10 years for an endangered species that we’re introducing to a new habitat. We’ll assume that we have the following information: the size of the founding (introduced) population (n), the juvenile survival rate (Sj, proportion juveniles surviving from birth to the first year), the adult survival rate (Sa, the annual rate of surviving adults to year 1 to maximum longevity), and the fertility rate of mature females (m, number of offspring born per female per reproductive cycle). Each one of these parameters has an associated uncertainty (ε) that combines both measurement error and environmental variation.
If we just took the mean value of each of these three demographic rates (survivals and fertility) and project a founding population of n = 10 individuals for 1o years into the future, we would have a single, deterministic estimate of the average outcome of introducing 10 individuals. As we already know, however, the variability, or stochasticity, is more important than the average outcome, because uncertainty in the parameter values (ε) will mean that a non-negligible number of model iterations will result in the extinction of the introduced population. This is something that most conservationists will obviously want to minimise.
So each time we run an iteration of the model, and generally for each breeding interval (most often 1 year at a time), we choose (based on some random-sampling regime) a different value for each parameter. This will give us a distribution of outcomes after the 10-year projection. Let’s say we did 1000 iterations like this; taking the number of times that the population went extinct over these iterations would provide us with an estimate of the population’s extinction probability over that interval. Of course, we would probably also vary the size of the founding population (say, between 10 and 100), to see at what point the extinction probability became acceptably low for managers (i.e., as close to zero as possible), but not unacceptably high that it would be too laborious or expensive to introduce that many individuals. Read the rest of this entry »
Dick’s latest paper in Molecular Ecology is a meta-analysis designed to test whether there are any genetic grounds for NOT attempting genetic rescue for inbreeding-depressed populations. I suppose a few definitions are in order here. Genetic rescue is the process, either natural or facilitated, where inbred populations (i.e., in a conservation sense, those comprising too many individuals bonking their close relatives because the population in question is small) receive genes from another population such that their overall genetic diversity increases. In the context of conservation genetics, ‘inbreeding depression‘ simply means reduced biological fitness (fertility, survival, longevity, etc.) resulting from parents being too closely related.
Seems like an important thing to avoid, so why not attempt to facilitate gene flow among populations such that those with inbreeding depression can be ‘rescued’? In applied conservation, there are many reasons given for not attempting genetic rescue: Read the rest of this entry »
I’ve had a good week at Stanford University with Paul Ehrlich where we’ve been putting the final touches1 on our book. It’s been taking a while to put together, but we’re both pretty happy with the result, which should be published by The University of Chicago Press within the first quarter of 2015.
It has indeed been a pleasure and a privilege to work with one of the greatest thinkers of our age, and let me tell you that at 82, he’s still a force with which to be reckoned. While I won’t divulge much of our discussions here given they’ll appear soon-ish in the book, I did want to raise one subject that I think we all need to think about a little more.
The issue is what we, as ecologists (I’m including conservation scientists here), choose to study and contemplate in our professional life.
I’m just as guilty as most of the rest of you, but I argue that our discipline is caught in a rut of irrelevancy on the grander scale. We spend a lot of time refining the basics of what we essentially already know pretty well. While there will be an eternity of processes to understand, species to describe, and relationships to measure, can our discipline really afford to avoid the biggest issues while biodiversity (and our society included) are flushed down the drain?
As you might recall, Dick Frankham, Barry Brook and I recently wrote a review in Biological Conservationchallenging the status quo regarding the famous 50/500 ‘rule’ in conservation management (effective population size [Ne] = 50 to avoid inbreeding depression in the short-term, and Ne = 500 to retain the ability to evolve in perpetuity). Well, it inevitably led to some comments arising in the same journal, but we were only permitted by Biological Conservation to respond to one of them. In our opinion, the other comment was just as problematic, and only further muddied the waters, so it too required a response. In a first for me, we have therefore decided to publish our response on the arXivpre-print server as well as here on ConservationBytes.com.
—
50/500 or 100/1000 debate is not about the time frame – Reply to Rosenfeld
cite as: Frankham, R, Bradshaw CJA, Brook BW. 2014. 50/500 or 100/1000 debate is not about the time frame – Reply to Rosenfeld. arXiv: 1406.6424 [q-bio.PE]25 June 2014.
The Letter from Rosenfeld (2014) in response to Jamieson and Allendorf (2012) and Frankham et al. (2014) and related papers is misleading in places and requires clarification and correction, as follows: Read the rest of this entry »
Some of you who are familiar with my colleagues’ and my work will know that we have been investigating the minimum viable population size concept for years (see references at the end of this post). Little did I know when I started this line of scientific inquiry that it would end up creating more than a few adversaries.
It might be a philosophical perspective that people adopt when refusing to believe that there is any such thing as a ‘minimum’ number of individuals in a population required to guarantee a high (i.e., almost assured) probability of persistence. I’m not sure. For whatever reason though, there have been some fierce opponents to the concept, or any application of it.
Yet a sizeable chunk of quantitative conservation ecology develops – in various forms – population viability analyses to estimate the probability that a population (or entire species) will go extinct. When the probability is unacceptably high, then various management approaches can be employed (and modelled) to improve the population’s fate. The flip side of such an analysis is, of course, seeing at what population size the probability of extinction becomes negligible.
But most reasonable people are likely to agree that < 1 % chance of going extinct over many generations (40, in the case of our suggestion) is an acceptable target. I’d feel pretty safe personally if my own family’s probability of surviving was > 99 % over the next 40 generations.
Some people, however, baulk at the notion of making generalisations in ecology (funny – I was always under the impression that was exactly what we were supposed to be doing as scientists – finding how things worked in most situations, such that the mechanisms become clearer and clearer – call me a dreamer).
So when we were attacked in several high-profile journals, it came as something of a surprise. The latest lashing came in the form of a Trends in Ecology and Evolutionarticle. We wrote a (necessarily short) response to that article, identifying its inaccuracies and contradictions, but we were unable to expand completely on the inadequacies of that article. However, I’m happy to say that now we have, and we have expanded our commentary on that paper into a broader review. Read the rest of this entry »
Given the popularity of certain prescriptive posts on ConservationBytes.com, I thought it prudent to compile a list of software that my lab and I have found particularly useful over the years. This list is not meant to be comprehensive, but it will give you a taste for what’s out there. I don’t list the plethora of conservation genetics software that is available (generally given my lack of experience with it), but if this is your chosen area, I’d suggest starting with Dick Frankham‘s excellent book, An Introduction to Conservation Genetics.
—
1. R: If you haven’t yet loaded the open-source R programming language on your machine, do it now. It is the single-most-useful bit of statistical and programming software available to anyone anywhere in the sciences. Don’t worry if you’re not a fully fledged programmer – there are now enough people using and developing sophisticated ‘libraries’ (packages of functions) that there’s pretty much an application for everything these days. We tend to use R to the exclusion of almost any other statistical software because it makes you learn the technique rather than just blindly pressing the ‘go’ button. You could also stop right here – with R, you can do pretty much everything else that the software listed below does; however, you have to be an exceedingly clever programmer and have a lot of spare time. R can also sometimes get bogged down with too much filled RAM, in which case other, compiled languages such as PYTHON and C# are useful.
2. VORTEX/OUTBREAK/META-MODEL MANAGER, etc.: This suite of individual-based projection software was designed by Bob Lacy & Phil Miller initially to determine the viability of small (usually captive) populations. The original VORTEX has grown into a multi-purpose, powerful and sophisticated population viability analysis package that now links to its cousin applications like OUTBREAK (the only off-the-shelf epidemiological software in existence) via the ‘command centre’ META-MODEL MANAGER (see an examples here and here from our lab). There are other add-ons that make almost any population projection and hindcasting application possible. And it’s all free! (warning: currently unavailable for Mac, although I’ve been pestering Bob to do a Mac version).
3. RAMAS: RAMAS is the go-to application for spatial population modelling. Developed by the extremely clever Resit Akçakaya, this is one of the only tools that incorporates spatial meta-population aspects with formal, cohort-based demographic models. It’s also very useful in a climate-change context when you have projections of changing habitat suitability as the base layer onto which meta-population dynamics can be modelled. It’s not free, but it’s worth purchasing. Read the rest of this entry »
Today we announced a HEAP of positions in our Global Ecology Lab for hot-shot, up-and-coming ecologists. If you think you’ve got what it takes, I encourage you to apply. The positions are all financed by the Australian Research Council from grants that Barry Brook, Phill Cassey, Damien Fordham and I have all been awarded in the last few years. We decided to do a bulk advertisement so that we maximise the opportunity for good science talent out there.
We’re looking for bright, mathematically adept people in palaeo-ecology, wildlife population modelling, disease modelling, climate change modelling and species distribution modelling.
The positions are self explanatory, but if you want more information, just follow the links and contacts given below. For my own selfish interests, I provide a little more detail for two of the positions for which I’m directly responsible – but please have a look at the lot.
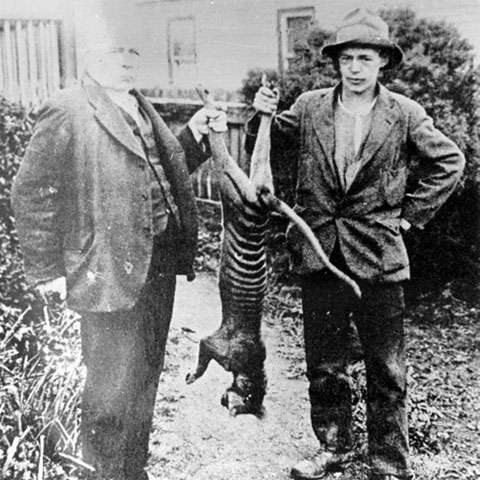
If you’re a rational person driven by evidence rather than hearsay, vested interest or faith, then the above examples probably sound ridiculous. But rest assured, millions of people adhere to these points of view because of the phenomenon mentioned in the first sentence above. With this background then, I introduce a paper that’s almost available online (i.e., we have the DOI, but the online version is yet to appear). Produced by our extremely clever post-doc, Tom Prowse, the paper is entitled: No need for disease: testing extinction hypotheses for the thylacine using multispecies metamodels, and will soon appear in Journal of Animal Ecology.
Of course, I am biased being a co-author, but I think this paper really demonstrates the amazing power of retrospective multi-species systems modelling to provide insight into phenomena that are impossible to test empirically – i.e., questions of prehistoric (and in some cases, even data-poor historic) ecological change. The megafauna die-off controversy is one we’ve covered before here on ConservationBytes.com, and this is a related issue with respect to a charismatic extinction in Australia’s recent history – the loss of the Tasmanian thylacine (‘tiger’, ‘wolf’ or whatever inappropriate eutherian epithet one unfortunately chooses to apply). Read the rest of this entry »
The title of this post serves two functions: (1) to introduce the concept of ecological catastrophes in population viability modelling, and (2) to acknowledge the passing of the bloke who came up with a clever way of dealing with that uncertainty.
I’ll start with latter first. It came to my attention late last year that a fellow conservation biologist colleague, Dr. David Reed, died unexpectedly from congestive heart failure. I did not really mourn his passing, for I had never met him in person (I believe it is disingenuous, discourteous, and slightly egocentric to mourn someone who you do not really know personally – but that’s just my opinion), but I did think at the time that the conservation community had lost another clever progenitor of good conservation science. As many CB readers already know, we lost a great conservation thinker and doer last year, Professor Navjot Sodhi (and that, I did take personally). Coincidentally, both Navjot and David died at about the same age (49 and 48, respectively). I hope that the being in one’s late 40s isn’t particularly presaged for people in my line of business!
My friend, colleague and lab co-director, Professor Barry Brook, did, however, work a little with David, and together they published some pretty cool stuff (see Referencesbelow). David was particularly good at looking for cross-taxa generalities in conservation phenomena, such as minimum viable population sizes, effects of inbreeding depression, applications of population viability analysis and extinction risk. But more on some of that below. Read the rest of this entry »
Last day of November already – I am now convinced that my suspicions are correct: time is not constant and in fact accelerates as you age (in mathematical terms, a unit of time becomes a progressively smaller proportion of the time elapsed since your birth, so this makes sense). But, I digress…
This short post will act mostly as a spruik for my upcoming talk at the International Congress for Conservation Biology next week in Auckland (10.30 in New Zealand Room 2 on Friday, 9 December) entitled: Species Ability to Forestall Extinction (SAFE) index for IUCN Red Listed species. The post also sets a bit of the backdrop to this paper and why I think people might be interested in attending.
The journal ended up delaying final publication because there were 3 groups who opposed the metric rather vehemently, including people who are very much in the conservation decision-making space and/or involved directly with the IUCN Red List. The journal ended up publishing our original paper, the 3 critiques, and our collective response in the same issue (you can read these here if you’re subscribed, or email me for a PDF reprint). Again, I won’t go into an detail here because our arguments are clearly outlined in the response.
What I do want to highlight is that even beyond the normal in-print tête-à-tête the original paper elicited, we were emailed by several people behind the critiques who were apparently unsatisfied with our response. We found this slightly odd, because many of the objections just kept getting re-raised. Of particular note were the accusations that: Read the rest of this entry »
DENR is custodian of a long-term macropod database derived from the State’s management of the commercial kangaroo harvest industry. The dataset entails aerial survey data for most of the State from 1978 to present, annual population estimates, quotas and harvests for three species: red kangaroo (Macropus rufus), western grey kangaroo (Macropus fuliginosus), and the euro (Macropus robustus erubescens). Read the rest of this entry »
But first, let’s recap what we have been arguing all along in several papers over the last few years (i.e., Brook et al. 2006; Traill et al. 2007, 2010; Clements et al. 2011) – a minimum viable population size is the point at which a declining population becomes a small population (sensu Caughley 1994). In other words, it’s the point at which a population becomes susceptible to random (stochastic) events that wouldn’t otherwise matter for a small population.
Consider the great auk (Pinguinus impennis), a formerly widespread and abundant North Atlantic species that was reduced by intensive hunting throughout its range. How did it eventually go extinct? The last remaining population blew up in a volcanic explosion off the coast of Iceland (Halliday 1978). Had the population been large, the small dent in the population due to the loss of those individuals would have been irrelevant.
But what is ‘large’? The empirical evidence, as we’ve pointed out time and time again, is that large = thousands, not hundreds, of individuals.
So this is why we advocate that conservation targets should aim to keep at or recover to the thousands mark. Less than that, and you’re playing Russian roulette with a species’ existence. Read the rest of this entry »
Note: I’ve just rehashed this post (30/03/2011) because the paper is now available online (see comment stream). Stay tuned for the media release next week. – CJAB
—
I’ve been more or less underground for the last 3 weeks. It has been a wonderful break (mostly) from the normally hectic pace of academic life. Thanks for all those who remain despite the recent silence.
But I’m back now with a post about a paper we’ve just had accepted in Frontiers in Ecology and Environment. In my opinion it’s a leap forward in how we measure relative threat risk among species, despite some criticism.
Now the fourth paper in this series has just been accepted (sorry, no link yet, but I’ll let you all know as soon as it is available), and it was organised and led by Reuben Clements, and co-written by me, Barry Brook and Bill Laurance.
The idea is fairly simple and it somewhat amazes me that it hasn’t been implemented before. The SAFE (Species Ability to Forestall Extinction) index is simply the distance a population is (in terms of abundance) from its MVP. In the absence of a species-specific value, we used the 5000-individual threshold. Thus, Read the rest of this entry »
Get Conservation Bytes by Email Enter your email address to receive new posts on conservation, biodiversity, and environmental science directly in your inbox. No need to visit the website regularly, and you can unsubscribe at any time.
Hulton Archive / Getty Images We warn readers that the content of this study is confronting and may be distressing. In April 1789, the first smallpox epidemic among Aboriginal people in the Sydney region began, just 16 months after Europeans arrived on the First Fleet. Little is known of the true scale of the epidemic,…
Just over two years ago I reported the ‘likely’ eradication of feral pigs from Australia’s third-largest (4,405 km2) island — Kangaroo Island. I indicated ‘likely’ because the program still required the proof-of-eradication phase to be completed before an official declaration could be made. Yesterday I had the immense honour to take part in the official…
Have you ever done any research that relied to any degree on Indigenous Knowledges? How did you cite those Knowledges, if at all? It’s probably time we rethink how we engage with Indigenous Knowledge systems. In a new article published in BioScience, we — a large group of Indigenous and non-Indigenous scholars in Australia —…


