Just over two years ago I reported the ‘likely’ eradication of feral pigs from Australia’s third-largest (4,405 km2) island — Kangaroo Island. I indicated ‘likely’ because the program still required the proof-of-eradication phase to be completed before an official declaration could be made.
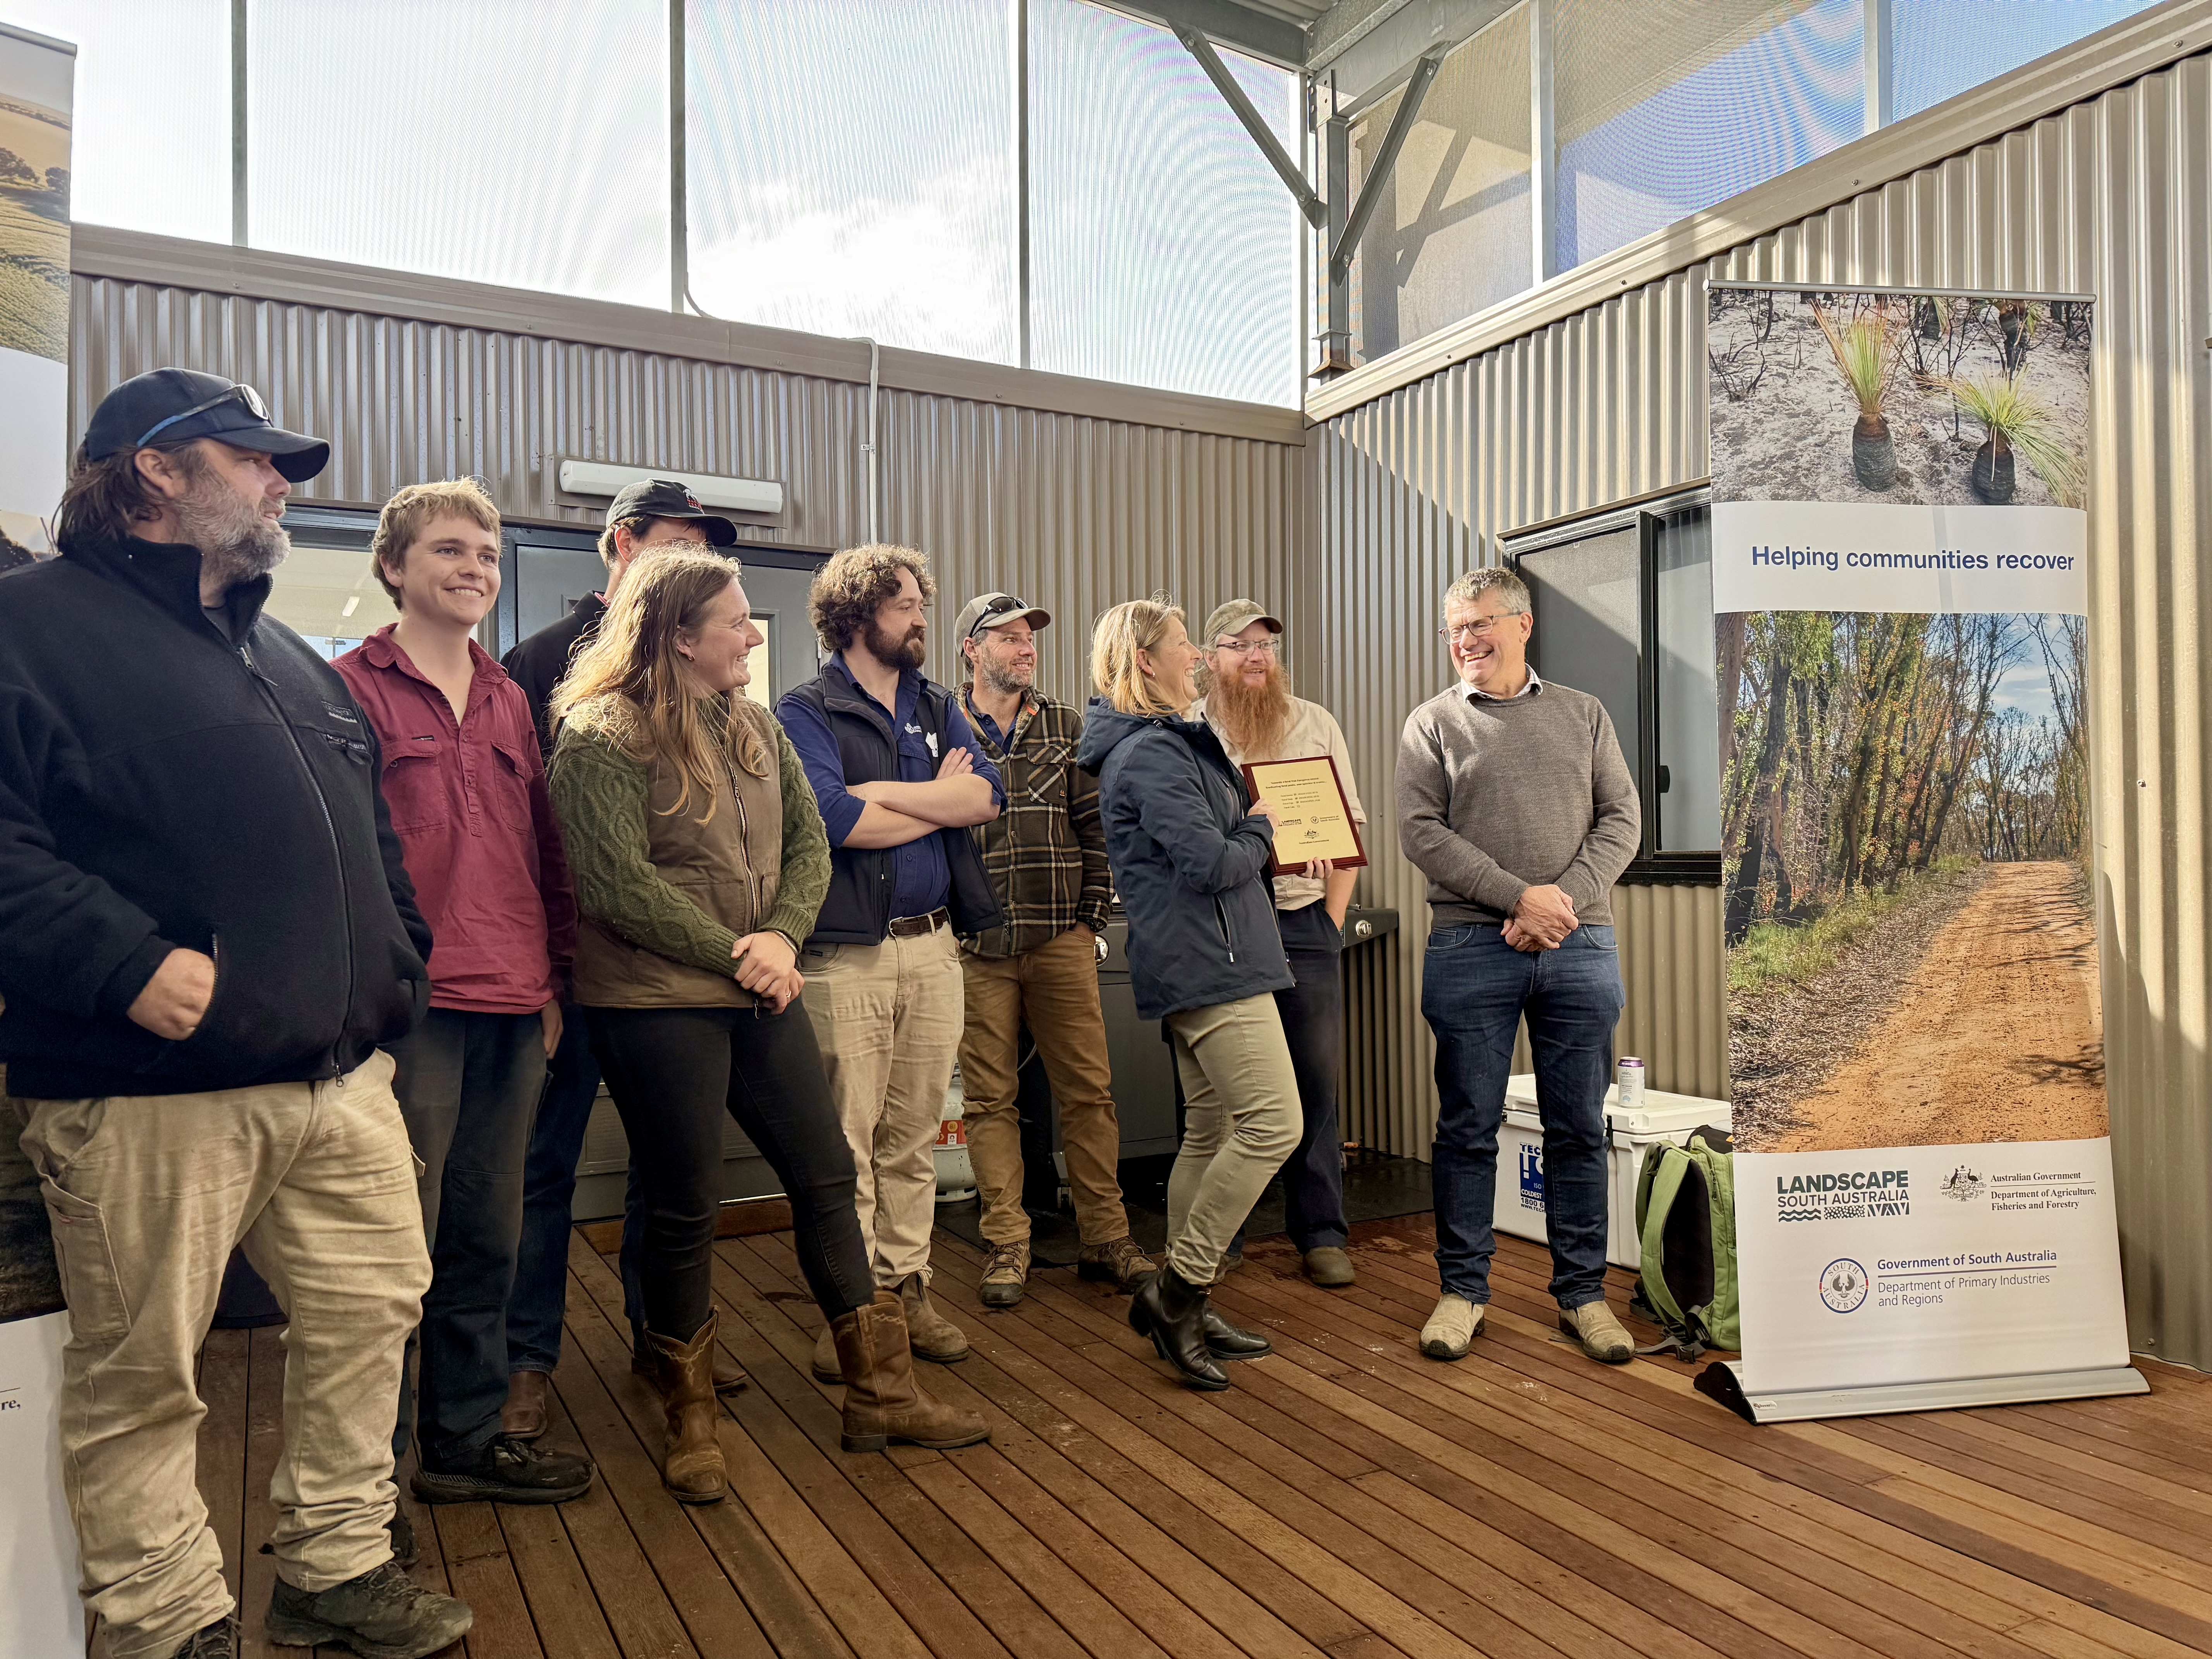
Yesterday I had the immense honour to take part in the official declaration ceremony held on Kangaroo Island near Karatta in the island’s southwest.
I can’t begin to emphasise enough how monumental this outcome is for biodiversity conservation, not just for South Australia, or even Australia, but globally.
This is without a doubt the largest island eradication of pigs anywhere in the world. Considering that most eradication (or even density-reduction) programs fail, the success is even more outstanding.
I am also taking some personal pride in the outcome because I had a small part to play. One dreary Sunday morning back in 2022, the head of PIRSA’s Invasive Species Unit Dr Brad Page rang me with an urgent request. “Corey”, he said without much preamble, “I need a model to tell me how much it would cost to get rid of pigs on Kangaroo Island, and I need it by this afternoon”.
A few weeks ago we published a paper that was in the works for a long time, so long in fact that one of my co-authors died before it was published online.
Paul Ehrlich died on 13 March 2026 at the ripe old age of 93, exactly two weeks before our article appeared online. Paul had a good innings no doubt, but I wish he had survived long enough to see what might very well be his last co-authored paper.
I first met Paul back in the mid-2000s during a trip through San Francisco. I had organised to come chat with Professor Gretchen Daily at Stanford, and Paul came along for lunch. I remember vividly how we clicked almost immediately.
We clicked so well in fact, that we wrote a book together, co-authored several high-impact papers (e.g., ‘ghastly future‘), spent a month in Bellagio as Rockefeller Foundation writing residents, participated in various public and parliamentary presentations, and generally just got on like a house on fire. Paul and his wife Ann became like family, so much so that they were de facto grandparents to my daughter who grew up with them in near-annual contact.
This post isn’t about Paul per se, but I cannot ignore the profound influence Paul had on my career, my personality, and my life view. I miss him. I am therefore dedicating this paper and post to his memory. So long, and thanks for all the fish.
Nothing like writing about human population to get the punters engaged.
We show empirically that the Earth has already exceeded its ability to support the global human population sustainably, with dire implications for increasing pressure on food security, climate stability, and human wellbeing. However, slowing population growth and raising global awareness could still offer us some hope.
Our study shows that humans have pushed well beyond the planet’s long-term carrying capacity and that continued growth under current patterns of consumption will intensify environmental and social challenges for communities worldwide.
The Black Summer bushfires of 2019–2020 that razed more than half of the landscape on Kangaroo Island in South Australia left an indelible mark on the island’s unique native biodiversity, which is still struggling to recover.
Flinders Chase National Park on Kangaroo Island after the 2019-2020 Black Summer fires (credit: CJA Bradshaw)
However, one big bonus for the environment’s recovery is the likely eradication of feral pigs (Sus scrofa). Invasive feral pigs cause a wide range of environmental, economic and social damages. In Australia, feral pigs occupy about 40% of the mainland and offshore islands, with a total, yet highly uncertain, population size estimated in the millions.
Feral pigs are recognised as a key threatening process under the Environment Protection and Biodiversity Conservation Act 1999, with impacts on at least 148 nationally threatened species and eight threatened ecological communities. They are a declared invasive species and the subject to control programs in all Australian jurisdictions.
Motion sensing cameras deployed during the eradication program capture feral pigs using their snouts to search for soil-borne food. This behaviour, called rooting, creates large areas of disturbed soil, killing native vegetation and spreading invasive weeds and pathogens (credit: PIRSA).
Imagine growing up beside the eastern Mediterranean Sea 14,000 years ago. You’re an accomplished sailor of the small watercraft you and your fellow villagers make, and you live off both the sea and the land.
But times have been difficult — there just isn’t the same amount of game or fish around as when you were a child. Maybe it’s time to look elsewhere for food.
Now imagine going farther than ever before in your little boat, accompanied maybe by a few others, when suddenly you spot something on the horizon. Is that an island?
The western coast of Cyprus. CJA Bradshaw / Flinders University
When you beach your boat to have a look around, you can’t believe what you’re seeing — tiny boar-sized hippos and horse-sized elephants that look like babies to your eyes. There are so many of them, and you’re hungry after the long journey.
The diminutive beasts don’t seem to show any fear. You easily kill a few and preserve the meat as best you can for the long journey back.
When you get home, you are excited to let everyone in the village know what you’ve found. Soon enough, you organise a major expedition back to the island.
Of course, we’ll never know if this kind of scenario took place, but it’s a plausible story of how and when the first humans managed to get to Cyprus. It also illustrates how they might have quickly brought about the demise of the tiny hippopotamusPhanourios minor, as well as the dwarf elephantPalaeoloxodon cypriotes.
Human overpopulation is often depicted in the media in one of two ways: as either a catastrophic disaster or an overly-exaggerated concern. Yet the data understood by scientists and researchers is clear. So what is the actual state of our overshoot, and, despite our growing numbers, are we already seeing the signs that the sixth mass extinction is underway?
In a recent episode of The Great Simplification podcast, Nate Hagens was joined by global ecologist Corey Bradshaw to discuss his recent research on the rapid decline in biodiversity, how population and demographics will change in the coming decades, and what both of these will mean for complex global economies currently reliant on a stable environment.
We are currently seeking a Research Fellow in Eco-epidemiology/Human Ecology to join our team at Flinders University.
The successful candidate will develop spatial eco-epidemiological models for the populations of Indigenous Australians exposed to novel diseases upon contact with the first European settlers in the 18th Century. The candidate will focus on:
developing code to model how various diseases spread through and modified the demography of the Indigenous population after first contact with Europeans;
contributing to the research project by working collaboratively with the research team to deliver key project milestones;
independently contributing to ethical, high-quality, and innovative research and evaluation through activities such as scholarship, publishing in recognised, high-quality journals and assisting the preparation and submission of bids for external research funding; and
supervising of Honours and postgraduate research projects.
The ideal candidate will have advanced capacity to develop eco-epidemiological models that expand on the extensive human demographic models already developed under the auspices of the Australian Research Council Centre of Excellence for Australian Biodiversity and Heritage, of which Flinders is the Modelling Node. To be successful in this role, the candidate will demonstrate experience in coding advanced spatial models including demography, epidemiology, and ecology. The successful candidate will also demonstrate:
Flooding in the Murray-Darling Basin is creating ideal breeding conditions for many native species that have evolved to take advantage of temporary flood conditions. Led by PhD candidate Rupert Mathwin, our team developed virtual models of the Murray River to reveal a crucial link between natural flooding and the extinction risk of endangered southern bell frogs (Litoria raniformis; also known as growling grass frogs).
Southern bell frogs are one of Australia’s 100 Priority Threatened Species. This endangered frog breeds during spring and summer when water levels increase in their wetlands. However, the natural flooding patterns in Australia’s largest river system have been negatively impacted by expansive river regulation that some years, sees up to 60% of river water extracted for human use.
Our latest paper describes how we built computer simulations of Murray-Darling Basin wetlands filled with simulated southern bell frogs. By changing the simulation from natural to regulated conditions, we showed that modern conditions dramatically increase the extinction risk of these beloved frogs.
The data clearly indicate that successive dry years raise the probability of local extinction, and these effects are strongest in smaller wetlands. Larger wetlands and those with more frequent inundation are less prone to these effects, although they are not immune to them entirely. The models present a warning — we have greatly modified the way the river behaves, and the modern river cannot support the long-term survival of southern bell frogs.’
Following my annual tradition, I present the retrospective list of the ‘top’ 20 influential papers of 2022 as assessed by experts in Faculty Opinions(formerly known as F1000). These are in no particular order. See previous years’ lists here: 2021, 2020, 2019, 2018, 2017, 2016, 2015, 2014, and 2013.
The other day I was asked to do an interview for a South Korean radio station about the declining-population “crisis”.
Therein lies the rub — there is no crisis.
While I think the interview went well (you can listen to it here), I didn’t have ample time to flesh out my arguments; I’ve decided to put them down in more detail here.
Probably the most important aspect that I didn’t even get a chance to cover is that globally, our economic system is essentially broken because we are forced to exist inside a paradigm that erroneously assumes Earth’s resources are infinite. They are not, as the global ecological footprint clearly shows.
To slow and perhaps even reverse climate change, as well as mitigate the extinction crisis underway, we are obliged to reduce consumption globally. Shrinking human populations will contribute to that goal (provided we simultaneously reduce per-capita consumption).
But that argument, no matter how defensible, is still not even remotely appreciated by most people. It is the aim of only a minority, most of whom have very little political power to engender change.
The reason for the hyped-up panic generally comes down to the overly simplistic ‘dependency ratio‘, which has several different forms but generally compares the number of people in the labour force against those who have retired from it. The idea here is that once the number of people no longer in the labour force exceeds the number of those in the labour force, the latter can no longer support the entirety of the former.
This simplistic 1:1 relationship essentially assumes that you need one person working to support one retired person. Errrh. Right. Let’s look at this in more detail.
As someone who regularly delves into human demography — often from a conservation perspective — I’m always on the lookout for quick and easy ways to get the latest and greatest datasets. Whether it’s for projection human populations, or just getting country-specific population densities, I’ve found a really nice way to interface great human data with R.
In this particular example, I’m using a api (application programming interface) key to access live data on the US Census Bureau server (don’t worry — they have global data, not just those specific to the US). What’s an ‘api key’? It’s just a code that gives you permission to access the server directly from an application via an internet link.
Step 1. Apply for an api key
This is a straightforward process and just needs to be done via this URL. The approval process doesn’t take long.
Using the get_idb() command, you can specify all sorts of queries to get various levels of data complexity. All the variable combinations for the international database are described well here.
Example 1. Life expectancy
Let’s say you wanted to plot a map of the world with the shading of a country related to its average life expectancy at birth. First we get the necessary data:
lex.dat <- idbr::get_idb( country = “all”, year = 2022, variables = c(“name”, “e0”), geometry = T)
The ensuing lex.dat object looks like this:
Simple feature collection with 6 features and 4 fields Geometry type: MULTIPOLYGON Dimension: XY Bounding box: xmin: -73.41544 ymin: -55.25 xmax: 75.15803 ymax: 42.68825 Geodetic CRS: SOURCECRS code year name e0 geometry 1 AF 2022 Afghanistan 53.65 MULTIPOLYGON (((61.21082 35… 2 AO 2022 Angola 62.11 MULTIPOLYGON (((16.32653 -5… 3 AL 2022 Albania 79.47 MULTIPOLYGON (((20.59025 41… 4 AE 2022 United Arab Emirates 79.56 MULTIPOLYGON (((51.57952 24… 5 AR 2022 Argentina 78.31 MULTIPOLYGON (((-65.5 -55.2… 6 AM 2022 Armenia 76.13 MULTIPOLYGON (((43.58275 41
As someone who writes a lot of models — many for applied questions in conservation management (e.g., harvest quotas, eradication targets, minimum viable population sizes, etc.), and supervises people writing even more of them, I’ve had many different experiences with their uptake and implementation by management authorities.
Some of those experiences have involved catastrophic failures to influence any management or policy. One particularly painful memory relates to a model we wrote to assist with optimising approaches to eradicate (or at least, reduce the densities of) feral animals in Kakadu National Park. We even wrote the bloody thing in Visual Basic (horrible coding language) so people could run the module in Excel. As far as I’m aware, no one ever used it.
Others have been accepted more readily, such as a shark-harvest model, which (I think, but have no evidence to support) has been used to justify fishing quotas, and one we’ve done recently for the eradication of feral pigs on Kangaroo Island (as yet unpublished) has led directly to increased funding to the agency responsible for the programme.
According to Altmetrics (and the online tool I developed to get paper-level Altmetric information quickly), only 3 of the 16 of what I’d call my most ‘applied modelling’ papers have been cited in policy documents:
I’m pleased to announce the publication of a paper led by Kathryn Venning (KV) that was derived from her Honours work in the lab. Although she’s well into her PhD on an entirely different topic, I’m overjoyed that she persevered and saw this work to publication.
Feral cats occupy every habitat in the country, from the high tropics to the deserts, and from the mountains to the sea. They adapt to the cold just as easily as they adapt to the extreme heat, and they can eat just about anything that moves, from invertebrates to the carcases of much larger animals that they scavenge.
Cats are Australia’s bane, but you can’t help but be at least a little impressed with their resilience.
Still, we have to try our best to get rid of them where we can, or at least reduce their densities to the point where their ecological damage is limited.
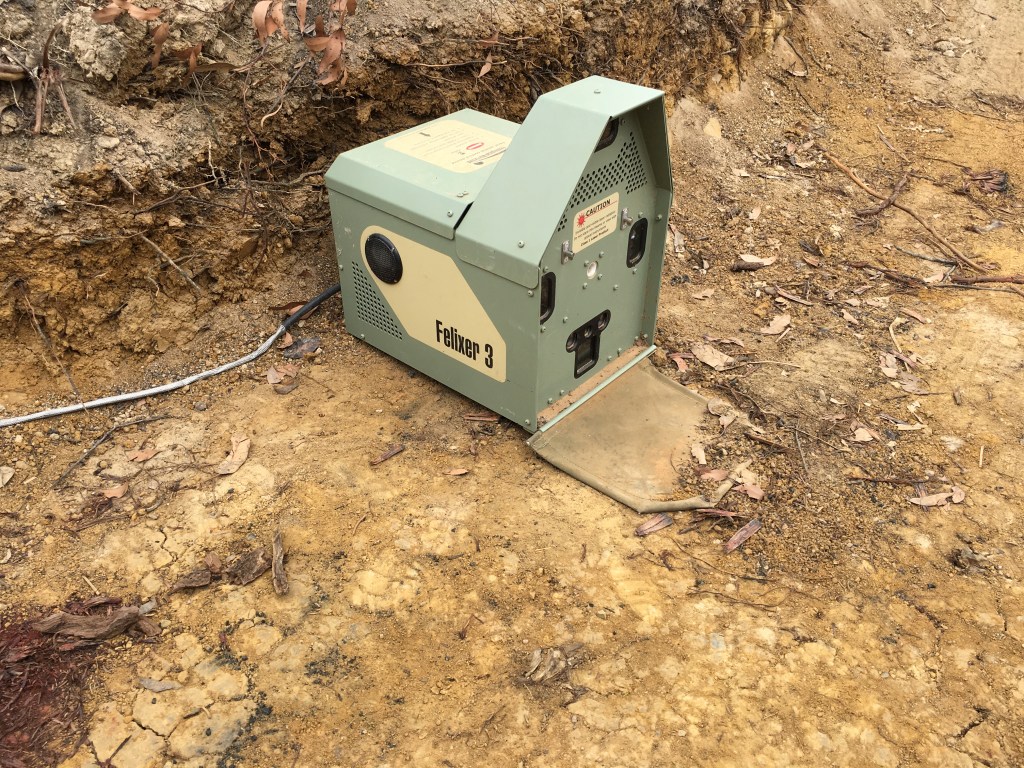
Typically, the only efficient and cost-effective way to do that is via lethal control, but by using various means. These can include direct shooting, trapping, aerial poison-baiting, and a new ‘smart’ method of targeted poison delivery via a prototype device known as a Felixer™️. The latter are particularly useful for passive control in areas where ground-shooting access is difficult.
A live Felixer™️ deployed on Kangaroo Island (photo: CJA Bradshaw 2020)
A few years back the federal government committed what might seem like a sizeable amount of money to ‘eradicate’ cats from Australia. Yeah, good luck with that, although the money has been allocated to several places where cat reduction and perhaps even eradication is feasible. Namely, on islands.
We know it is more than 60,000 years since the first people entered the continent of Sahul — the giant landmass that connected New Guinea, Australia and Tasmania when sea levels were lower than today.
But where the earliest people moved across the landscape, how fast they moved, and how many were involved, have been shrouded in mystery.
Our latest research, published today shows the establishment of populations in every part of this giant continent could have occurred in as little as 5,000 years. And the entire population of Sahul could have been as high as 6.4 million people.
This translates to more than 3 million people in the area that is now modern-day Australia, far more than any previous estimate.
The first people could have entered through what is now western New Guinea or from the now-submerged Sahul Shelf off the modern-day Kimberley (or both).
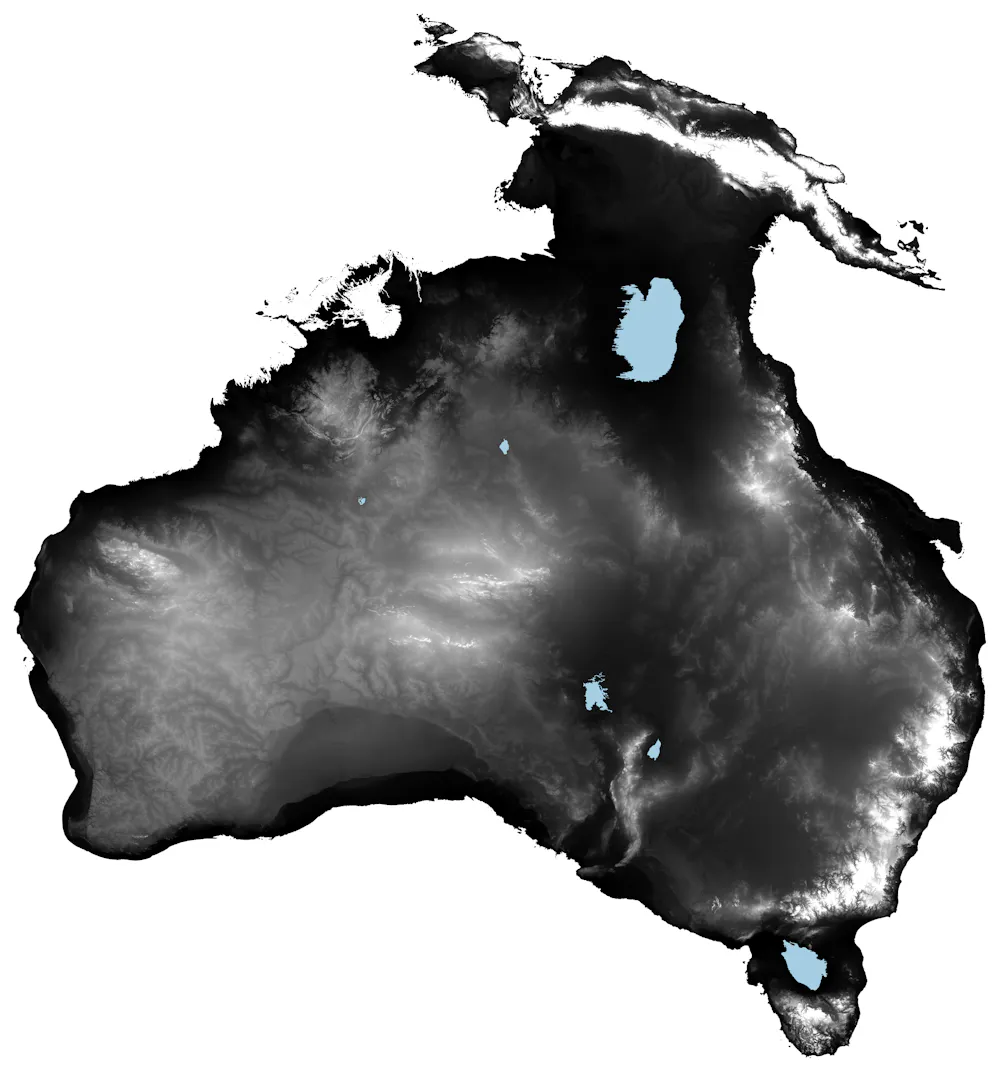
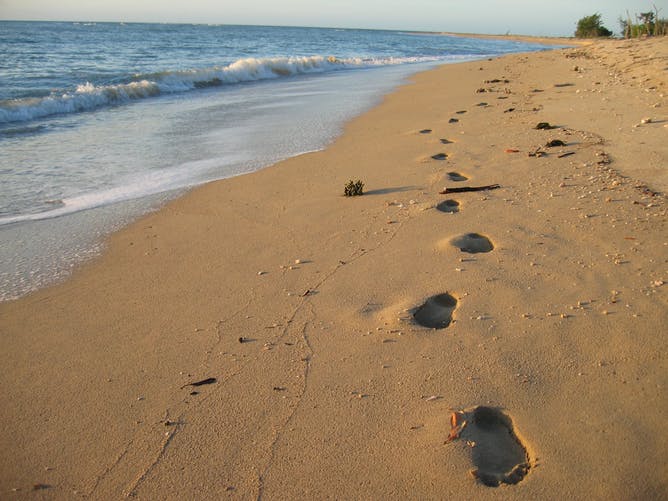
But whichever the route, entire communities of people arrived, adapted to and established deep cultural connections with Country over 11 million square kilometres of land, from northwestern Sahul to Tasmania.
Map of what Australia looked like for most of the human history of the continent when sea levels were lower than today. Author provided
This equals a rate of population establishment of about 1km per year (based on a maximum straight-line distance of about 5,000km from the introduction point to the farthest point).
That’s doubly impressive when you consider the harshness of the Australian landscape in which people both survived and thrived.
For many years I’ve been interested in modelling the extinction dynamics of megafauna. Apart from co-authoring a few demographically simplified (or largely demographically free) models about how megafauna species could have gone extinct, I have never really tried to capture the full nuances of long-extinct species within a fully structured demographic framework.
That is, until now.
But how do you get the life-history data of an extinct animal that was never directly measured. Surely, things like survival, reproductive output, longevity and even environmental carrying capacity are impossible to discern, and aren’t these necessary for a stage-structured demographic model?
The answer to the first part of that question “it’s possible”, and to the second, it’s “yes”. The most important bit of information we palaeo modellers need to construct something that’s ecologically plausible for an extinct species is an estimate of body mass. Thankfully, palaeontologists are very good at estimating the mass of the things they dig up (with the associated caveats, of course). From such estimates, we can reconstruct everything from equilibrium densities, maximum rate of population growth, age at first breeding, and longevity.
But it’s more complicated than that, of course. In Australia anyway, we’re largely dealing with marsupials (and some monotremes), and they have a rather different life-history mode than most placentals. We therefore have to ‘correct’ the life-history estimates derived from living placental species. Thankfully, evolutionary biologists and ecologists have ways to do that too.
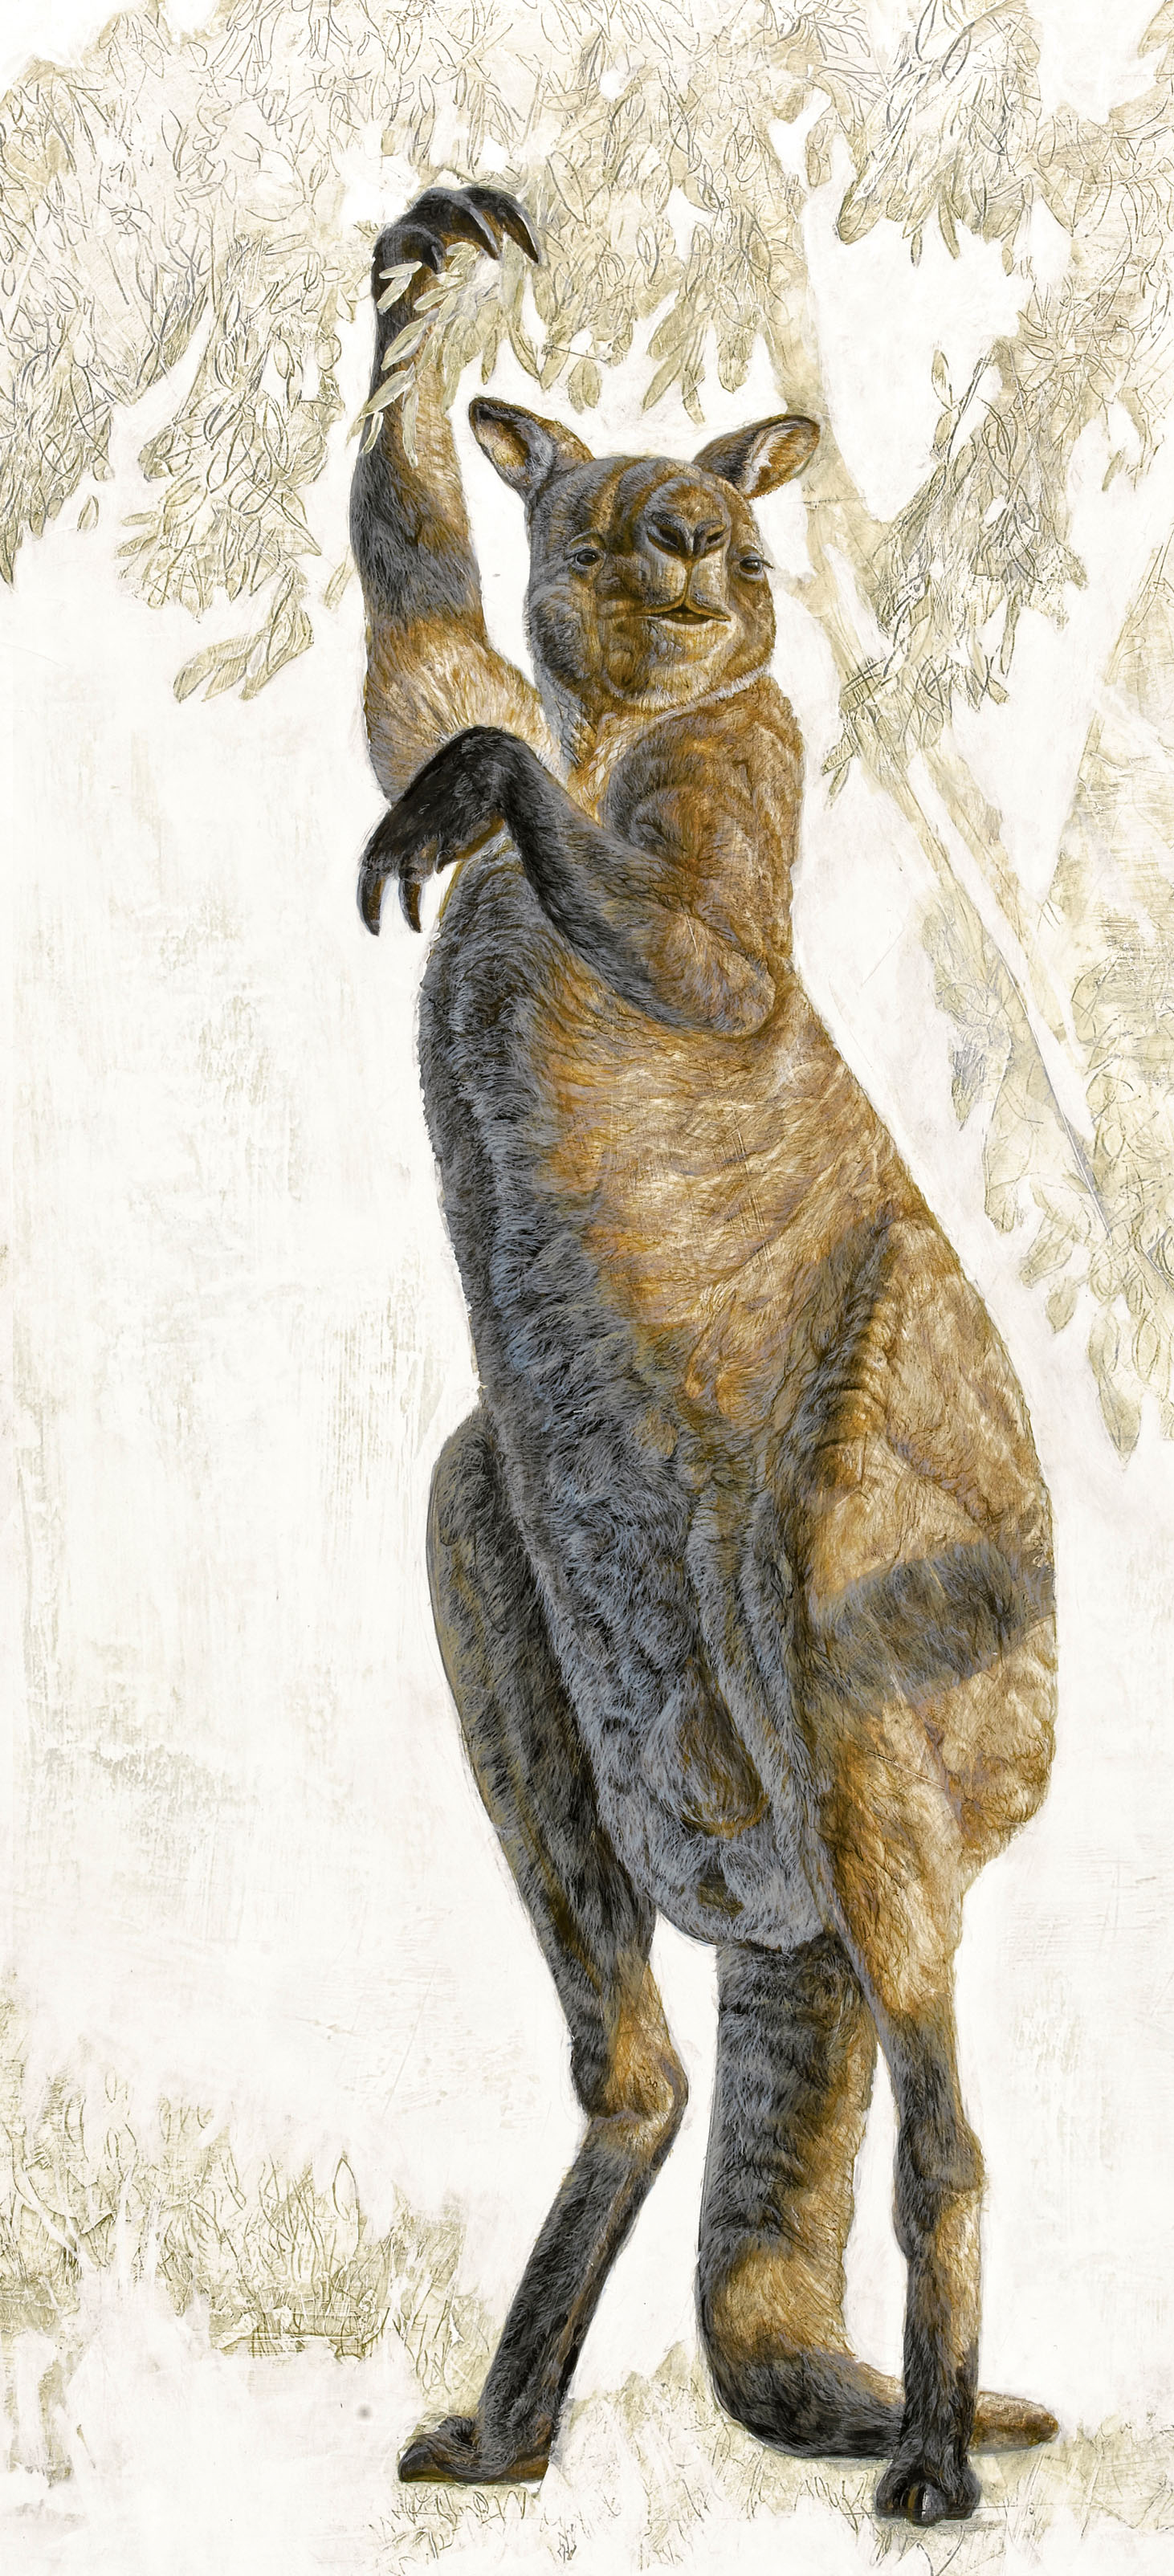
The Pleistocene kangaroo Procoptodon goliah, the largest and most heavily built of the short-faced kangaroos, was the largest and most heavily built kangaroo known. It had an unusually short, flat face and forwardly directed eyes, with a single large toe on each foot (reduced from the more normal count of four). Each forelimb had two long, clawed fingers that would have been used to bring leafy branches within reach.
So with a battery of ecological, demographic, and evolutionary tools, we can now create reasonable stochastic-demographic models for long-gone species, like wombat-like creatures as big as cars, birds more than two metres tall, and lizards more than seven metres long that once roamed the Australian continent.
Ancient clues, in the shape of fossils and archaeological evidence of varying quality scattered across Australia, have formed the basis of several hypotheses about the fate of megafauna that vanished during a peak about 42,000 years ago from the ancient continent of Sahul, comprising mainland Australia, Tasmania, New Guinea and neighbouring islands.
There is a growing consensus that multiple factors were at play, including climate change, the impact of people on the environment, and access to freshwater sources.
Just published in the open-access journal eLife, our latest CABAH paper applies these approaches to assess how susceptible different species were to extinction – and what it means for the survival of species today.
Using various characteristics such as body size, weight, lifespan, survival rate, and fertility, we (Chris Johnson, John Llewelyn, Vera Weisbecker, Giovanni Strona, Frédérik Saltré & me) created population simulation models to predict the likelihood of these species surviving under different types of environmental disturbance.
We compared the results to what we know about the timing of extinction for different megafauna species derived from dated fossil records. We expected to confirm that the most extinction-prone species were the first species to go extinct – but that wasn’t necessarily the case.
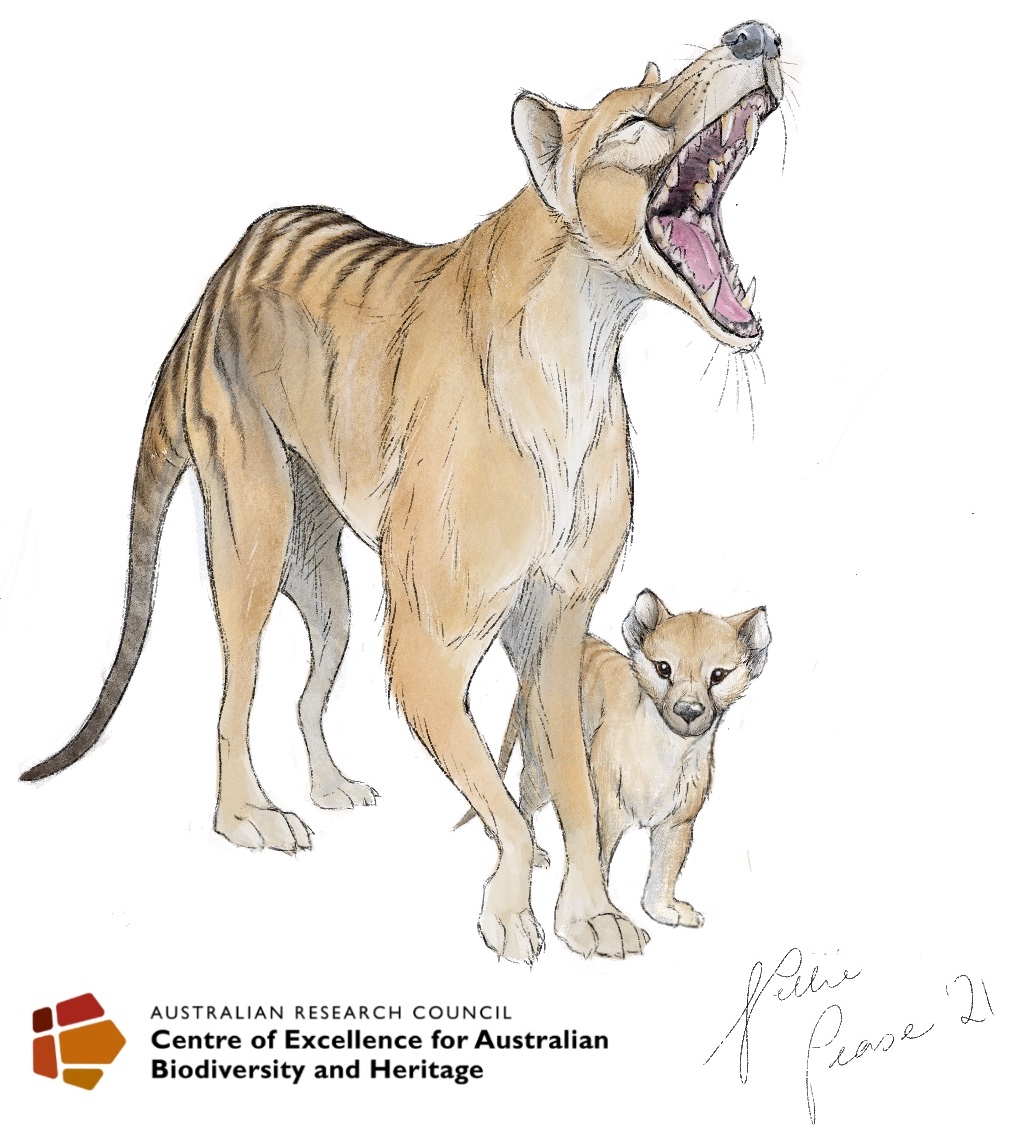
While we did find that slower-growing species with lower fertility, like the rhino-sized wombat relative Diprotodon, were generally more susceptible to extinction than more-fecund species like the marsupial ‘tiger’ thylacine, the relative susceptibility rank across species did not match the timing of their extinctions recorded in the fossil record.
Indeed, we found no clear relationship between a species’ inherent vulnerability to extinction — such as being slower and heavier and/or slower to reproduce — and the timing of its extinction in the fossil record.
In fact, we found that most of the living species used for comparison — such as short-beaked echidnas, emus, brush turkeys, and common wombats — were more susceptible on average than their now-extinct counterparts.
However, this time I’ve strayed from my recent bibliometric musings and developed something that’s more compatible with the core of my main research and interests.
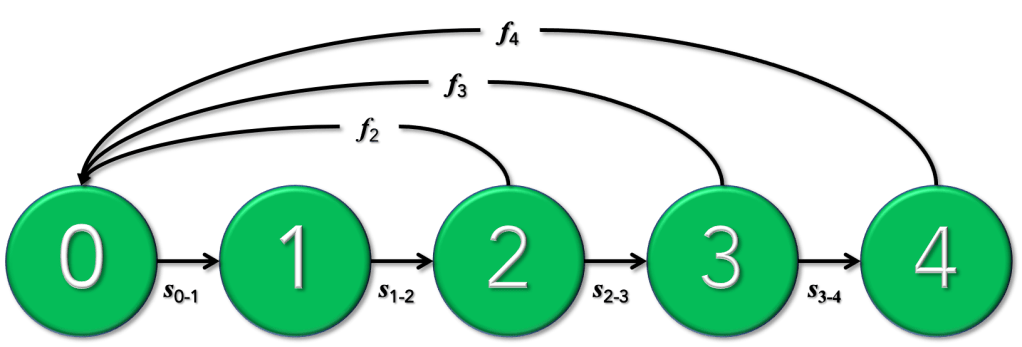
Over the years I’ve taught many students the basics of population modelling, with the cohort-based approaches dominating the curriculum. Of these, the simpler ‘Leslie’ (age-classified) matrix models are both the easiest to understand and for which data can often be obtained without too many dramas.
But unless you’re willing to sit down and learn the code, they can be daunting to the novice.
Sure, there are plenty of software alternatives out there, such as Bob Lacy‘s Vortex (a free individual-based model available for PCs only), Resit Akçakaya & co’s RAMAS Metapop ($; PC only), Stéphane Legendre‘s Unified Life Models (ULM; open-source; all platforms), and Charles Todd‘s Essential (open-source; PC only) to name a few. If you’re already an avid R user and already into population modelling, you might be familiar with the population-modelling packages popdemo, OptiPopd, or sPop. I’m sure there are still other good resources out there of which I’m not aware.
But, even to install the relevant software or invoke particular packages in R takes a bit of time and learning. It’s probably safe to assume that many people find the prospect daunting.
It’s for this reason that I turned my newly acquired R Shiny skills to matrix population models so that even complete coding novices can run their own stochastic population models.
I know that it’s not the best way to project expected deaths from a pandemic disease, but being something of a demographer, I just couldn’t help myself.
I therefore took the liberty of punching in some basic probabilities into our world population model to see how many people could potentially die from covid19. But this is not an epidemiological model, so I’m probably vastly over-estimating the total death rates.
Nonetheless, the results were revealing.
I first took the expected mortality by age class based on the Chinese data so far. I then assumed a worst-case scenario of a 60% infection rate (i.e., 3 out of 5 of us will eventually catch the virus). I assumed these values across the entire globe (not taking into account greater or lesser susceptibility or probability of death among countries or regions).
I also considered two more scenarios: (i) double the mortality rate (in each age class), and (ii) the disease outbreak lasting two years instead of just one.
The graph below shows the four different outcomes based on these scenarios relative to the baseline (no covid): Read the rest of this entry »
One of the most ancient peopling events of the great diaspora of anatomically modern humans out of Africa more than 50,000 years ago — human arrival in the great continent of Sahul (New Guinea, mainland Australia & Tasmania joined during periods of low sea level) — remains mysterious. The entry routes taken, whether migration was directed or accidental, and just how many people were needed to ensure population viability are shrouded by the mists of time. This prompted us to build stochastic, age-structured human population-dynamics models incorporating hunter-gatherer demographic rates and palaeoecological reconstructions of environmental carrying capacity to predict the founding population necessary to survive the initial peopling of late-Pleistocene Sahul.
—
As ecological modellers, we are often asked by other scientists to attempt to render the highly complex mechanisms of entire ecosystems tractable for virtual manipulation and hypothesis testing through the inevitable simplification that is ‘a model’. When we work with scientists studying long-since-disappeared ecosystems, the challenges multiply.
Add some multidisciplinary data and concepts into the mix, and the complexity can quickly escalate.
This is how we tackled one of these big questions: just how did the first anatomically modern Homo sapiens make it to the continent and survive?
At that time, Australia was part of the giant continent of Sahul that connected New Guinea, mainland Australia, and Tasmania at times of lower sea level. In fact, throughout most of last ~ 126,000 years (late Pleistocene and much of the Holocene), Sahul was the dominant landmass in the region (see this handy online tool for how the coastline of Sahul changed over this period).
Female green turtles (Chelonia mydas) spawning (top) and diving (bottom) on Raine Island (Great Barrier Reef, Queensland, Australia) — photos courtesy of Ian Bell. This species is ‘Endangered’ globally since 1982, mainly from egg harvesting (poaching conflict in Mexico for olive ridleyLepidochelys olivacea featured by National Geographic’s video here), despite the success of conservation projects (39). Green turtles inhabit tropical and subtropical seas in all oceans. Adults can grow > 150 kg and live for up to ~ 75 years. Right after birth, juveniles venture into the open sea to recruit ultimately in coastal areas until sexual maturity. They then make their first reproductive migration, often over 1000s of km (see footage of a real dive of a camera-equipped green turtle), to reach their native sandy beaches where pregnant females will lay their eggs. Each female can deposit more than one hundred eggs in her nest, and in several clutches in the same season because they can store the sperm from multiple mating events.
When sex is determined by the thermal environment, males or females might predominate under sustained climatic conditions. A study about marine turtles from the Great Barrier Reef illustrates how feminisation of a population can be partitioned geographically when different reproductive colonies are exposed to contrasting temperatures.
Fortunately, most people in Western societies already perceive that we live in a complex blend of sexual identities, far beyond the kind of genitals we are born with. Those identities start to establish themselves in the embryo before the sixth week of pregnancy. In the commonest scenario, for a human foetusXY with one maternal chromosome (X) and one paternal (Y) chromosome, the activation of the Sry gen (unique to Y) will trigger the differentiation of testicles and, via hormonal pathways, the full set of male characteristics (1).
Absence of that gene in an XX embryo will normally lead to a woman. However, in just one of many exceptions to the rule, Sry-expression failure in XY individuals can result in sterile men or ambiguous genitals — along a full gradient of intermediate sexes and, potentially, gender identities. A 2015 Nature ‘News’ feature echoes two extraordinary cases: (i) a father of four children found to bear a womb during an hernia operation, and (ii) a pregnant mother found to host both XX and XY cells during a genetic test – with her clinical geneticist stating “… that’s the kind of science-fiction material for someone who just came in for an amniocentesis” (2). These real-life stories simply reflect that sex determination is a complex phenomenon.
This might seem a little left-of-centre for CB.com subject matter, but hang in there, this does have some pretty important conservation implications.
In our quest to be as transdisciplinary as possible, I’ve team up with a few people outside my discipline to put together a PhD modelling project that could really help us understand how human colonisation shaped not only ancient ecosystems, but also our own ancient cultures.
Thanks largely to the efforts of Dr Frédérik Saltré here in the Global Ecology Laboratory, at Flinders University, and in collaboration with Dr Bastien Llamas (Australian Centre for Ancient DNA), Joshua Birchall (Museu Paraense Emílio Goeldi, Brazil), and Lars Fehren-Schmitz (University of California at Santa Cruz, USA), I think the student could break down a few disciplinary boundaries here and provide real insights into the causes and consequences of human expansion into novel environments.
Interested? See below for more details?
Languages are ‘documents of history’ and historical linguists have developed comparative methods to infer patterns of human prehistory and cultural evolution. The Americas present a more substantive diversity of indigenous language stock than any other continent; however, whether such a diversity arose from initial human migration pathways across the continent is still unknown, because the primary proxy used (i.e., archaeological evidence) to study modern human migration is both too incomplete and biased to inform any regional inference of colonisation trajectories. Read the rest of this entry »
I published this last week on The Conversation, and now reproducing it here for CB.com readers.
—
Two days ago, the last male northern white rhino (Ceratotherium simum cottoni) died. His passing leaves two surviving members of his subspecies: both females who are unable to bear calves.
Even though it might not be quite the end of the northern white rhino because of the possibility of implanting frozen embryos in their southern cousins (C. simum simum), in practical terms, it nevertheless represents the end of a long decline for the subspecies. It also raises the question: how many individuals does a species need to persist?
Fiction writers have enthusiastically embraced this question, most often in the post-apocalypsegenre. It’s a notion with a long past; the Adam and Eve myth is of course based on a single breeding pair populating the entire world, as is the case described in the Ragnarok, the final battle of the gods in Norse mythology.
This idea dovetails neatly with the image of Noah’s animals marching “two by two” into the Ark. But the science of “minimum viable populations” tells us a different story.
Get Conservation Bytes by Email Enter your email address to receive new posts on conservation, biodiversity, and environmental science directly in your inbox. No need to visit the website regularly, and you can unsubscribe at any time.
Hulton Archive / Getty Images We warn readers that the content of this study is confronting and may be distressing. In April 1789, the first smallpox epidemic among Aboriginal people in the Sydney region began, just 16 months after Europeans arrived on the First Fleet. Little is known of the true scale of the epidemic,…
Just over two years ago I reported the ‘likely’ eradication of feral pigs from Australia’s third-largest (4,405 km2) island — Kangaroo Island. I indicated ‘likely’ because the program still required the proof-of-eradication phase to be completed before an official declaration could be made. Yesterday I had the immense honour to take part in the official…
Have you ever done any research that relied to any degree on Indigenous Knowledges? How did you cite those Knowledges, if at all? It’s probably time we rethink how we engage with Indigenous Knowledge systems. In a new article published in BioScience, we — a large group of Indigenous and non-Indigenous scholars in Australia —…


 This might seem a little left-of-centre for


