Species-area & species-accumulation curves not the same

30 05 2016

IBI’ve just read an elegant little study that has identified the main determinants of differences in the slope of species-area curves and species-accumulation curves.

That’s a bit of a mouthful for the uninitiated, so if you don’t know much about species-area theory, let me give you a bit of background for why this is an important new discovery.

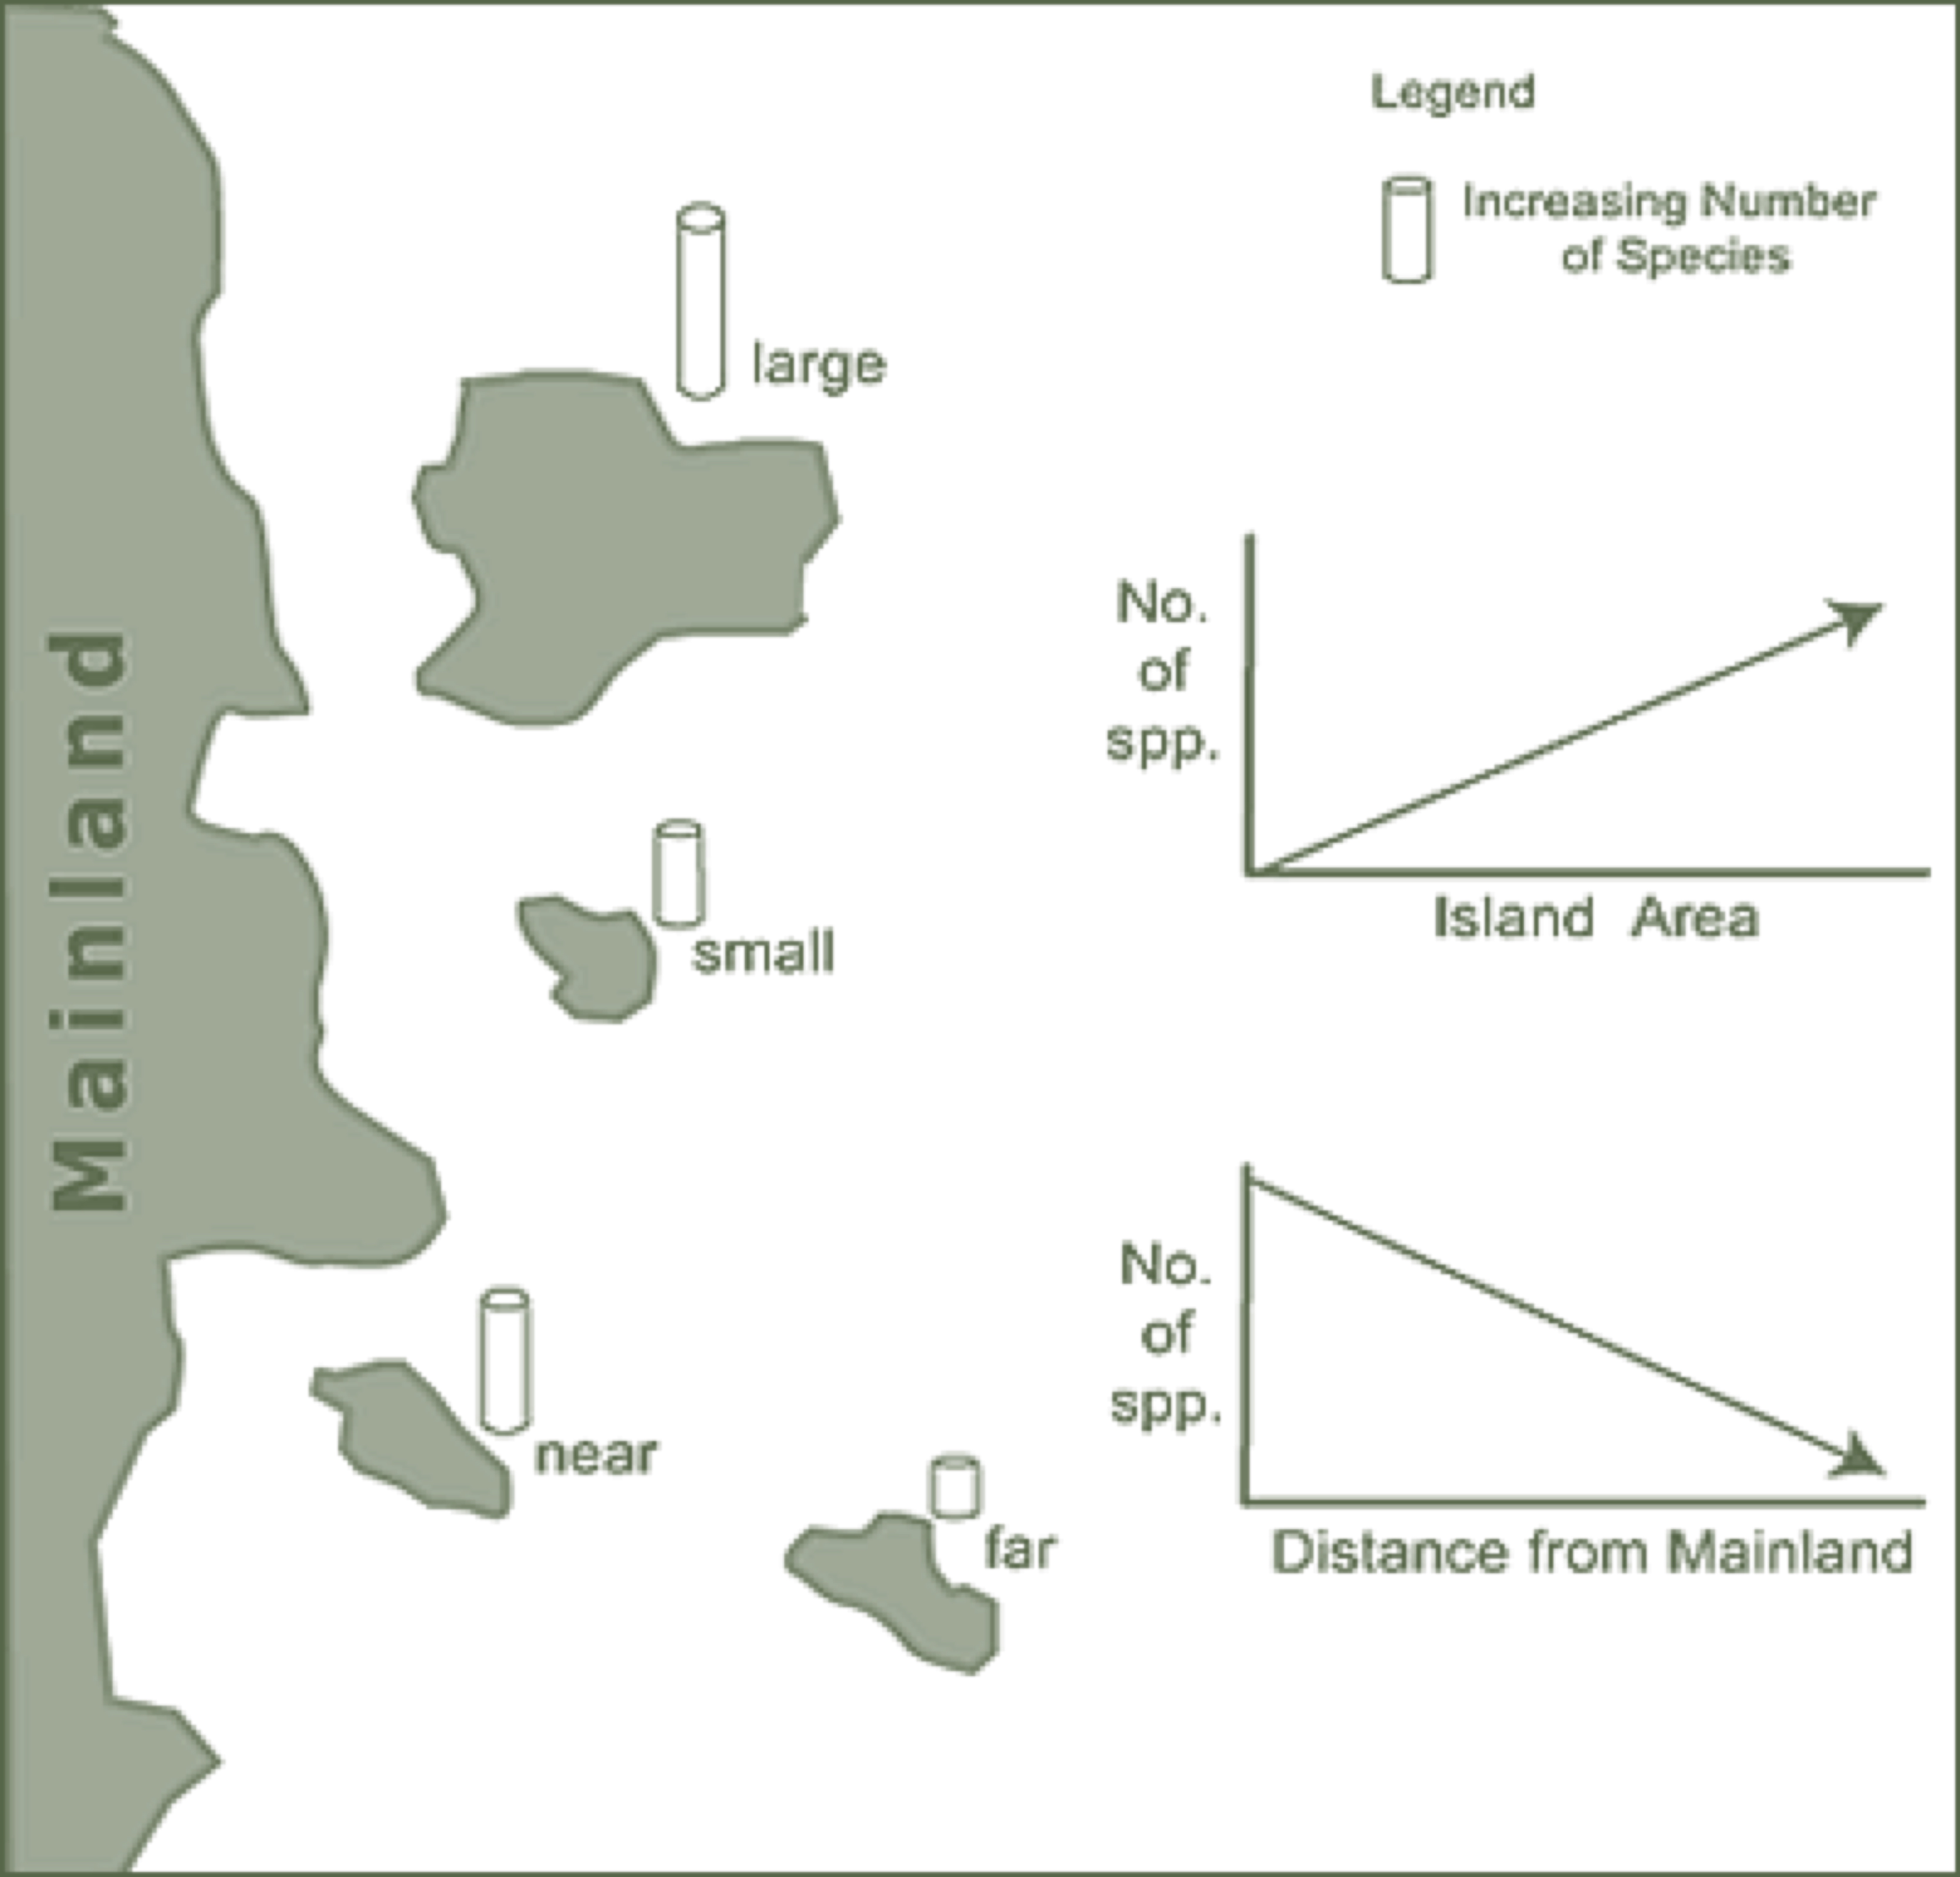
Perhaps one of the only ‘laws’ in ecology comes from the observation that as you sample from larger and larger areas of any habitat type, the number of species tends to increase. This of course originates from MacArthur & Wilson’s classic book, The Theory of Island Biography (1967), and while simple in basic concept, it has since developed into a multi-headed Hydra of methods, analysis, theory and jargon.

One of the most controversial aspects of generic species-area relationships is the effect of different sampling regimes, a problem I’ve blogged about before. Whether you are sampling once-contiguous forest of habitat patches in a ‘matrix’ of degraded landscape, a wetland complex, a coral reef, or an archipelago of true oceanic islands, the ‘ideal’ models and the interpretation thereof will likely differ, and in sometimes rather important ways from a predictive and/or applied perspective. Read the rest of this entry »


Homage to Hanski

21 05 2016

The Quantitative & Applied Ecology Group

Hanski06A tribute from QAECO

Ecology lost a giant last week. It was with great sadness that we at QAECO heard of Professor Ilkka Hanski’s passing after a long illness. Ilkka’s career profoundly affected us. From metapopulation theory, through expansive empirical research, to conservation planning, Ilkka’s research stood as an exemplar that focused our minds and spurred us on. He delivered not just a framework for understanding the complex world of spatial population dynamics, but set a bench mark of rigour that lifted our own aspirations.

Looking back at Ilkka’s career takes one on a fascinating journey. It begins in the fields of Finland, where Ilkka spent long hours of his youth collecting butterflies, bees and beetles. In his own words, it left a lasting impression (Hanski 1999), searing two key elements of population dynamics onto his mind: the importance of habitat patchiness to species distributions, and the changeability of species…

View original post 1,979 more words


Cartoon guide to biodiversity loss XXXVII

18 05 2016

Another six biodiversity cartoons because I have a full-on month of lecturing. I’ll call this one the ‘over-population’ issue. See full stock of previous ‘Cartoon guide to biodiversity loss’ compendia here.

Read the rest of this entry »


Australia pisses away the little water it has

9 05 2016

cow_drinking_australia_dryWater, water nowhere, with little left to drink.

Australians are superlative natural resource wasters, but living in the driest inhabited continent on the planet, you’d think we’d be precious about our water use.

You’d be wrong.

On the contrary, Australia has a huge water footprint (defined as “the total volume of freshwater that is used to produce the goods and services consumed by the people of the nation”). For internal domestic use (i.e., not including agricultural and industrial uses, or water imported directly or within other goods), Australians use about 341000 litres per person per year (data from 1997–2001), which is six times the global average of 57000 litres per person per year (1).

Agricultural production is one of the chief consumers of freshwater around the world. For example, the global average virtual water content of rice (paddy) is 2.29 million litres/tonne produced, and for wheat it is 1.33 litres/tonne. Growing crops for biofuel in particular has a huge water footprint — depending on the crop in question, it takes an average of 1400–20000 litres of water to produce just one litre of biofuel (2). If an agricultural product comes from livestock — say, meat, leather, or wool — the water content is typically much higher because of the feed required to keep the animal alive. For example, it takes about three years to raise beef cattle to slaughtering age, with an average of 200 kg of boneless beef produced per animal. This requires about 1,300 kg of grains, 7200 kg of pasture or hay, and 31000 litres of water for drinking and cleaning. This means that the total amount of water required to produce 1 kg of beef is about 15340 litres (1). For Australia, which has over 20 million or so cattle at any one moment, the water footprint alone should at least be cause for concern the next time you tuck into a steak dinner. Read the rest of this entry »


%d bloggers like this: