What we know we don’t know about animal tolerances to high temperatures

30 01 2023

Each organism has a limit of tolerance to cold and hot temperatures. So, the closer it lives to those limits, the higher the chances of experiencing thermal stress and potentially dying. In our recent paper, we revise gaps in the knowledge of tolerance to high temperatures in cold-blooded animals (ectotherms), a diverse group mostly including amphibians and reptiles (> 16,000 species), fish (> 34,000 species), and invertebrates (> 1,200,000 species).

As a scientist, little is more self-realising than to write and publish a conceptual paper that frames the findings of your own previous applied-research papers. This is the case with an opinion piece we have just published in Basic and Applied Ecology1 — 10 years, 4 research papers2-5 [see related blog posts here, here, here and here], and 1 popular-science article6 after I joined the Department of Biogeography and Global Change (Spanish National Research Council) to study the thermal physiology of Iberian lizards under the supervision of Miguel Araújo and David Vieites.

Iberian lizards for which heat tolerance is known (varying from 40 to 45 °C)
 
[left, top to bottom] Iberian emerald lizard (Lacerta schreiberi, from Alameda del Valle/Madrid) and Geniez’s wall lizard (Podarcis virescens, Fuertescusa/Cuenca), and [right, top to bottom] Algerian sand racer (Psammodromus algirus, Navacerrada/Madrid), Andalusian wall lizard (Podarcis vaucheri, La Barrosa/Cádiz), Valverde’s lizard (Algyroides marchi, Riópar/Albacete), and Cyren’s rock lizard (Iberolacerta cyreni, Valdesquí/Madrid). Heat-tolerance data deposited here and used to evaluate instraspecific variation of heat tolerance3,4. Photos: Salvador Herrando-Pérez.

In our new paper, we examine how much we know and what areas of research require further development to advance our understanding of how and why the tolerance of ectotherm fauna to high environmental temperature (‘heat tolerance’ hereafter) varies within and across the Earth’s biomes. We focus on data gaps using the global database GlobTherm as a reference template (see Box 1 below).

Our three main tenets

1. Population versus species data: Most large-scale ecophysiological research is based on modelling one measurement of heat tolerance per species (typically representing one population and/or physiological assay) over hundreds to thousands of species covering broad geographical, phylogenetic, and climatic gradients.

But there is ample evidence that heat tolerance changes a lot among populations occupying different areas of the distribution of a species, and such variation must be taken into account to improve our predictions of how species might respond to environmental change and face extinction.

Read the rest of this entry »


Children born today will see literally thousands of animals disappear in their lifetime, as global food webs collapse

17 12 2022
Frida Lannerstrom/Unsplash, CC BY

Corey J. A. Bradshaw, Flinders University and Giovanni Strona, University of Helsinki

Climate change is one of the main drivers of species loss globally. We know more plants and animals will die as heatwaves, bushfires, droughts and other natural disasters worsen.

But to date, science has vastly underestimated the true toll climate change and habitat destruction will have on biodiversity. That’s because it has largely neglected to consider the extent of “co-extinctions”: when species go extinct because other species on which they depend die out.

Our new research shows 10% of land animals could disappear from particular geographic areas by 2050, and almost 30% by 2100. This is more than double previous predictions. It means children born today who live to their 70s will witness literally thousands of animals disappear in their lifetime, from lizards and frogs to iconic mammals such as elephants and koalas.

But if we manage to dramatically reduce carbon emissions globally, we could save thousands of species from local extinction this century alone.

Ravages of drought will only worsen in coming decades.
CJA Bradshaw

An extinction crisis unfolding

Every species depends on others in some way. So when a species dies out, the repercussions can ripple through an ecosystem.

For example, consider what happens when a species goes extinct due to a disturbance such as habitat loss. This is known as a “primary” extinction. It can then mean a predator loses its prey, a parasite loses its host or a flowering plant loses its pollinators.

A real-life example of a co-extinction that could occur soon is the potential loss of the critically endangered mountain pygmy possum (Burramys parvus) in Australia. Drought, habitat loss, and other pressures have caused the rapid decline of its primary prey, the bogong moth (Agrotis infusa).

Read the rest of this entry »


Cartoon guide to biodiversity loss LXXIV

5 09 2022

Welcome to the fourth set of 7 cartoons for 2022. See full stock of previous ‘Cartoon guide to biodiversity loss’ compendia here.


Read the rest of this entry »


Should we bring back the thylacine? We asked 5 experts

17 08 2022
Tasmanian Museum and Art Gallery

Signe Dean, The Conversation

In a newly announced partnership with Texas biotech company Colossal Biosciences, Australian researchers are hoping their dream to bring back the extinct thylacine is a “giant leap” closer to fruition.

Scientists at University of Melbourne’s TIGRR Lab (Thylacine Integrated Genetic Restoration Research) believe the new partnership, which brings Colossal’s expertise in CRISPR gene editing on board, could result in the first baby thylacine within a decade.

The genetic engineering firm made headlines in 2021 with the announcement of an ambitious plan to bring back something akin to the woolly mammoth, by producing elephant-mammoth hybrids or “mammophants”.

But de-extinction, as this type of research is known, is a highly controversial field. It’s often criticised for attempts at “playing God” or drawing attention away from the conservation of living species. So, should we bring back the thylacine? We asked five experts.

Read the rest of this entry »


Cartoon guide to biodiversity loss LXXIII

15 07 2022

Welcome to the fourth set of 6 cartoons for 2022. See full stock of previous ‘Cartoon guide to biodiversity loss’ compendia here.


Read the rest of this entry »


Cartoon guide to biodiversity loss LXXII

30 05 2022

Welcome to the third set of 6 cartoons for 2022. See full stock of previous ‘Cartoon guide to biodiversity loss’ compendia here.


Read the rest of this entry »


The integrity battlefield: where science meets policy

4 03 2022

Professor Ross Thompson, University of Canberra


On the whole, I am inclined to conclude that my experience of academia and publishing my work has been largely benign. Despite having published 120-odd peer-reviewed papers, I can count the number of major disputes on one hand. Where there have been disagreements, they have centred on issues of content, and despite the odd grumble, things have rarely escalated to the ad hominem. I have certainly never experienced concerted attacks on my work.

But that changed recently. I work in water science, participating in and leading multi-disciplinary teams that do research directly relevant to water policy and management. My colleagues and I work closely with state and federal governments and are often funded by them through a variety of mechanisms. Our teams are a complex blend of scientists from universities, state and federal research agencies, and private-sector consultancies. Water is big business in Australia, and its management is particularly pertinent as the world’s driest inhabited continent struggles to come to terms with the impacts of climate change.

In the last 10 years, Australia has undergone a AU$16 billion program of water reform that has highlighted the extreme pressure on ecosystems, rural communities, and water-dependent industries. In 2019, two documentaries (Cash Splash and Pumped) broadcast by the Australian Broadcasting Corporation were highly critical of the  outcomes of water reform. A group of scientists involved in working on the Murray-Darling Basin were concerned enough about the accuracy of aspects of those stories to support Professor Rob Vertessy from the University of Melbourne in drafting an Open Letter in response. I was a co-author on that letter, and something into which I did not enter lightly. We were very concerned about being seen to advocate for any particular policy position, but were simultaneously committed to contributing to an informed public debate. A later investigation by the Australian Communications and Media Authority also highlighted concerns with the Cash Splash documentary.

Fast forward to 2021 and the publication of a paper by Colloff et al. (2021) in the Australasian Journal of Water Resources. In that paper, the authors were critical of the scientists that had contributed to the Open Letter and claimed they had been subject to “administrative capture” and “issue advocacy”. Administrative capture is defined here as:

Read the rest of this entry »


Cartoon guide to biodiversity loss LXX

16 02 2022

Here is the first set of biodiversity cartoons for 2022. See full stock of previous ‘Cartoon guide to biodiversity loss’ compendia here.


Read the rest of this entry »


An eye on the past: a view to the future

29 11 2021

originally published in Brave Minds, Flinders University’s research-news publication (text by David Sly)

Clues to understanding human interactions with global ecosystems already exist. The challenge is to read them more accurately so we can design the best path forward for a world beset by species extinctions and the repercussions of global warming.


This is the puzzle being solved by Professor Corey Bradshaw, head of the Global Ecology Lab at Flinders University. By developing complex computer modelling and steering a vast international cohort of collaborators, he is developing research that can influence environmental policy — from reconstructing the past to revealing insights of the future.

As an ecologist, he aims both to reconstruct and project how ecosystems adapt, how they are maintained, and how they change. Human intervention is pivotal to this understanding, so Professor Bradshaw casts his gaze back to when humans first entered a landscape – and this has helped construct an entirely fresh view of how Aboriginal people first came to Australia, up to 75,000 years ago.

Two recent papers he co-authored — ‘Stochastic models support rapid peopling of Late Pleistocene Sahul‘, published in Nature Communications, and ‘Landscape rules predict optimal super-highways for the first peopling of Sahul‘ published in Nature Human Behaviour — showed where, how and when Indigenous Australians first settled in Sahul, which is the combined mega-continent that joined Australia with New Guinea in the Pleistocene era, when sea levels were lower than today.

Professor Bradshaw and colleagues identified and tested more than 125 billion possible pathways using rigorous computational analysis in the largest movement-simulation project ever attempted, with the pathways compared to the oldest known archaeological sites as a means of distinguishing the most likely routes.

The study revealed that the first Indigenous people not only survived but thrived in harsh environments, providing further evidence of the capacity and resilience of the ancestors of Indigenous people, and suggests large, well-organised groups were able to navigate tough terrain.

Read the rest of this entry »


Cartoon guide to biodiversity loss LXVIII

19 10 2021

Here is the fifth set of biodiversity cartoons for 2021. See full stock of previous ‘Cartoon guide to biodiversity loss’ compendia here.


Read the rest of this entry »


Cartoon guide to biodiversity loss LXVII

13 08 2021

Here is the fourth set of biodiversity cartoons for 2021. See full stock of previous ‘Cartoon guide to biodiversity loss’ compendia here.


Read the rest of this entry »


Interval between extremely wet years increasing?

16 07 2021

The other day I was playing around with some Bureau of Meteorology data for my little patch of the Adelaide Hills (free data — how can I resist?), when I discovered an interesting trend.

Living on a little farm with a small vineyard, I’m rather keen on understanding our local weather trends. Being a scientist, I’m also rather inclined to analyse data.

My first question was given the strong warming trend here and everywhere else, plus ample evidence of changing rainfall patterns in Australia (e.g., see here, here, here, here, here), was it drying out, getting wetter, or was the seasonal pattern of rainfall in my area changing?

I first looked to see if there was any long-term trend in total annual rainfall over time. Luckily, the station records nearest my farm go all the way back to 1890:

While the red line might suggest a slight decrease since the late 19th Century, it’s no different to an intercept-only model (evidence ratio = 0.84) — no trend.

Here’s the R code to do that analysis (you can download the data here, or provide your own data in the same format):

## IMPORT MONTHLY PRECIPITATION DATA
dat <- read.table("monthlyprecipdata.csv", header=T, sep=",")

## CALCULATE ANNUAL VECTORS
precip.yr.sum <- xtabs(dat$Monthly.Precipitation.Total..millimetres. ~ dat$Year)
precip.yr.sum <- precip.yr.sum[-length(precip.yr.sum)]
year.vec <- as.numeric(names(precip.yr.sum))

## PLOT
plot(year.vec, as.numeric(precip.yr.sum), type="l", pch=19, xlab="year", ylab="annual precipitation (mm)")
fit.yr <- lm(precip.yr.sum ~ year.vec)
abline(fit.yr, lty=2, lwd=2, col="red")
abline(h=mean(as.numeric(precip.yr.sum)),lty=2, lwd=3)

## TEST FOR TREND
# functions
AICc <- function(...) {
  models <- list(...)
  num.mod <- length(models)
  AICcs <- numeric(num.mod)
  ns <- numeric(num.mod)
  ks <- numeric(num.mod)
  AICc.vec <- rep(0,num.mod)
  for (i in 1:num.mod) {
    if (length(models[[i]]$df.residual) == 0) n <- models[[i]]$dims$N else n <- length(models[[i]]$residuals)
    if (length(models[[i]]$df.residual) == 0) k <- sum(models[[i]]$dims$ncol) else k <- (length(models[[i]]$coeff))+1
    AICcs[i] <- (-2*logLik(models[[i]])) + ((2*k*n)/(n-k-1))
    ns[i] <- n
    ks[i] <- k
    AICc.vec[i] <- AICcs[i]
  }
  return(AICc.vec)
}

delta.AIC <- function(x) x - min(x) ## where x is a vector of AIC
weight.AIC <- function(x) (exp(-0.5*x))/sum(exp(-0.5*x)) ## Where x is a vector of dAIC
ch.dev <- function(x) ((( as.numeric(x$null.deviance) - as.numeric(x$deviance) )/ as.numeric(x$null.deviance))*100) ## % change in deviance, where x is glm object

linreg.ER <- function(x,y) { # where x and y are vectors of the same length; calls AICc, delta.AIC, weight.AIC functions
  fit.full <- lm(y ~ x); fit.null <- lm(y ~ 1)
  AIC.vec <- c(AICc(fit.full),AICc(fit.null))
  dAIC.vec <- delta.AIC(AIC.vec); wAIC.vec <- weight.AIC(dAIC.vec)
  ER <- wAIC.vec[1]/wAIC.vec[2]
  r.sq.adj <- as.numeric(summary(fit.full)[9])
  return(c(ER,r.sq.adj))
}

linreg.ER(year.vec, as.numeric(precip.yr.sum))
Read the rest of this entry »


Losing half of tropical fish species as corals disappear

30 06 2021

When snorkelling in a reef, it’s natural to think of coral colonies as a colourful scenography where fish act in a play. But what would happen to the fish if the stage went suddenly empty, as in Peter Brook’s 1971 Midsummer Night’s Dream? Would the fish still be there acting their roles without a backdrop?


This question is not novel in coral-reef science. Ecologists have often compared reef fish diversity and biomass in selected localities before and after severe events of coral mortality. Even a temporary disappearance of corals might have substantial effects on fish communities, sometimes resulting in a local disappearance of more than half of local fish species.

Considering the multiple, complex ways fish interact with — and depend on — corals, this might appear as an obvious outcome. Still, such complexity of interactions makes it difficult to predict how the loss of corals might affect fish diversity in specific contexts, let alone at the global scale.

Focusing on species-specific fish-coral associations reveals an inconsistent picture with local-scale empirical observations. When looking at the fraction of local fish diversity that strictly depends on corals for food and other more generic habitat requirements (such as shelter and reproduction), the global picture suggests that most fish diversity in reef locality might persist in the absence of corals. 

The mismatch between this result and the empirical evidence of a stronger coral dependence suggests the existence of many hidden ecological paths connecting fish to corals, and that those paths might entrap many fish species for which the association to corals is not apparent.

Read the rest of this entry »


Is the IPCC finally catching up with the true severity of climate change?

24 06 2021

I’m not in any way formally involved in either the IPCC or IPBES, although I’ve been involved indirectly in analysing many elements of both the language of the reports and the science underlying their predictions.


Today, The Guardian reported that a leaked copy of an IPCC report scheduled for release soon indicated that, well, the climate-change situation is in fact worse than has been previously reported in IPCC documents.

If you’re a biologist, climatologist, or otherwise-informed person, this won’t come as much of a surprise. Why? Well, the latest report finally recognises that the biosphere is not just some big balloon that slowly inflates or deflates with the whims of long-term climate variation. Instead, climate records over millions of years show that the global climate can and often does shift rapidly between different states.

This is the concept of ‘tipping points’.

Read the rest of this entry »


Cartoon guide to biodiversity loss LXVI

29 05 2021

Here is the third set of biodiversity cartoons for 2021. See full stock of previous ‘Cartoon guide to biodiversity loss’ compendia here.


Read the rest of this entry »


No, you can’t argue the Medieval warm period is evidence that today’s climate change isn’t all that bad

23 04 2021
As this reconstructed village shows, Vikings made it as far as Newfoundland during the Medieval warm period. Wikimedia/Dylan Kereluk, CC BY-SA


Frédérik Saltré, Flinders University and Corey J. A. Bradshaw, Flinders University


What was the Medieval warm period? What caused it, and did carbon dioxide play a role?

We are living in a world that is getting warmer year by year, threatening our environment and way of life.

But what if these climate conditions were not exceptional? What if it had already happened in the past when human influences were not part of the picture?

The often mentioned Medieval warm period seems to fit the bill. This evokes the idea that if natural global warming and all its effects occurred in the past without humans causing them, then perhaps we are not responsible for this one. And it does not really matter because if we survived one in the past, then we can surely survive one now.

But it’s just not that simple.


Read more: 2,000 years of records show it’s getting hotter, faster


The Medieval climate anomaly

This Medieval period of warming, also known as the Medieval climate anomaly, was associated with an unusual temperature rise roughly between 750 and 1350 AD (the European Middle Ages). The available evidence suggests that at times, some regions experienced temperatures exceeding those recorded during the period between 1960 and 1990. Read the rest of this entry »


Cartoon guide to biodiversity loss LXV

10 03 2021

Here is the second set of biodiversity cartoons for 2021. See full stock of previous ‘Cartoon guide to biodiversity loss’ compendia here.


Read the rest of this entry »


Citizens ask the experts in climate-change communication

7 02 2021

In the second of two consecutive interviews with climate-change experts (see the first one here), readers of the Spanish magazine Quercus have a chat with Katharine Hayhoe. Her words blend hope with the most putrid reality of economics and politics. May this interview inspire some environment-friendly changes in our daily routines and in how we see the beautiful life that surrounds us.


PhD in climate science, professor in political science and co-director of the Climate Centre at Texas Tech University (USA), Katharine Hayhoe works on climate projections and mitigation (1-3). Her prominent profile as communicator (4-6) made her one of the 100th most influential people in the world. To the left, Katharine has “A conversation on climate change” with citizens at the Lyndon Baines Johnson Presidential Library and Museum (Austin). Photo credits: Artie Limmer (portrait) & Jay Godwin (talk).


Interview done 20 October 2020

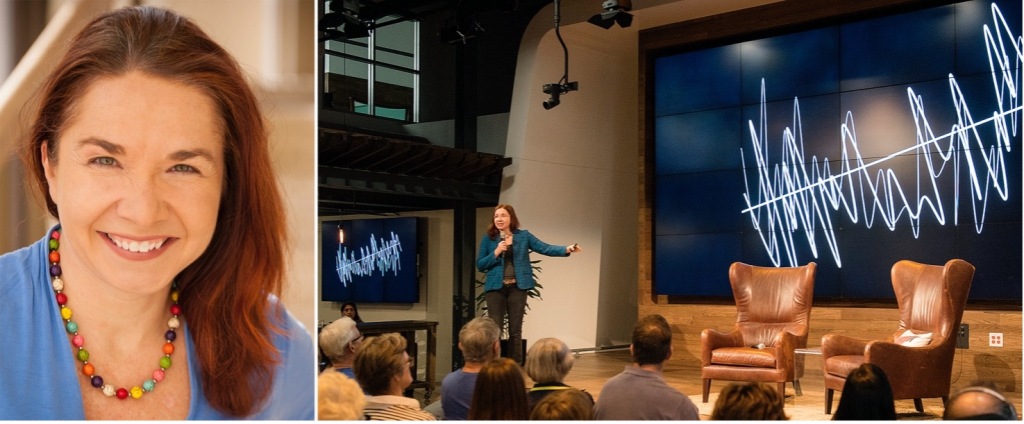
Below we italicise each question and the name of the person asking the question and cite a range of publications we deem relevant per question. For expanding on Katharyne Hayhoe’s views on climate change, see a sample of her public talks here and here, interviews here and here, and newspaper articles here and here. We love one of the titles of her newspaper articles “A thermometer is not liberal or conservative”. A spanish version of this article and interview has been published in the February 2021 issue of the magazine Quercus.


Question 1 of 4: There are extraordinarily influential people on a global scale who have a utilitarian perspective of nature, and think that climate change (be it of anthropogenic origin or not) entails advantages and opportunities to Western economies, and that we will be able to adapt whether changes are reversible or irreversible. Can we engage or use those influential people in any possible way to abate climate change? (7, 8) Iñaki García Pascual (Environmental geologist)

Hayhoe:

Climate change has some localised, short-term, specific benefits (9). One example is increased access to oil and gas resources in a melting Arctic (10). This temporarily profits oil and gas industries, provides some financial benefit to local communities in Greenland and Alaska short-term, and harms both them and everyone else in the long term. A book called Windfall by Mackenzie Funk describes who is “profiteering” from climate change, and how. 

Overall, however, climate change already harms the majority of people today. The poor, the vulnerable, and the marginalized are affected first and foremost. Since the 1960s, for example, climate change has increased the gap between the richest and poorest countries in the world by as much as 25 per cent. In 2019, UN Special Rapporteur on extreme poverty and human rights, Philip Alston, warned that climate change “threatens to undo the last 50 years” of development, global health and poverty reduction.” (11)

And while the rich may be able to temporarily “buy their way out of rising heat and hunger”, as Alston put it, the truth is that we all live on this planet, no matter how wealthy and influential we are. The air we breathe, the water we drink, the food we eat and all the resources we use come from our shared home. 

Climate change threatens the ability of our planet to support human civilisation as we know it. It is a threat multiplier, attacking our health, our economy, our resources and even our security. As climate change intensifies and economic markets crumble and refugee crises surge, even those who may temporarily benefit from a warmer world will be negatively impacted by these changes long-term.

That’s why it makes so much sense to take practical steps to limit carbon pollution now. Many of these actions also provide us with short-term benefits that can be quantified in economic terms: like energy savings through efficiency, cheaper electricity from renewables, more jobs, better public transportation, and even faster cars (like Tesla). Climate action also provides less tangible but arguably even more important benefits: cleaner air and water, better health, poverty reduction, and a host of other co-benefits that substantively move us towards meeting key UN Sustainable Development Goals.

To care about climate change, we don’t have to be a certain type of person or live in a certain place or vote a certain way: all we have to be is a human living on this planet, and we’re all that.

Read the rest of this entry »


Cartoon guide to biodiversity loss LXIV

7 01 2021

As the pandemic rages globally, and the fragility of the American political system goes on full display, I give you the first set of biodiversity cartoons for 2021. See full stock of previous ‘Cartoon guide to biodiversity loss’ compendia here.


Read the rest of this entry »


Influential conservation papers of 2020

19 12 2020

Following my late-December tradition, I present — in no particular order — a retrospective list of the ‘top’ 20 influential papers of 2020 as assessed by experts in Faculty Opinions (formerly known as F1000). See previous years’ lists here: 201920182017201620152014, and 2013.


Life in fluctuating environments — “… it tackles a fundamental problem of bio-ecology (how living beings cope with the fluctuations of the environment) with a narrative that does not make use of the cumbersome formulas and complicated graphs that so often decorate articles of this kind. Instead, the narrative and the illustrations are user-friendly and easy to understand, while being highly informative.

Forest carbon sink neutralized by pervasive growth-lifespan trade-offs — “… deals with a key process in the global carbon cycle: whether climate change (CC) is enhancing the natural sink capacity of ecosystems or not.

Bending the curve of terrestrial biodiversity needs an integrated strategy — “… explores different scenarios about the consequences of habitat conversion on terrestrial biodiversity.

Rebuilding marine life — “The logic is: leave nature alone, and it will come back. Not necessarily as it was before, but it will come back.

Towards a taxonomically unbiased European Union biodiversity strategy for 2030 — “… states that the emperor has no clothes, providing an estimate of the money dedicated to biodiversity conservation (a lot of money) and then stating that the bulk of biodiversity remains unstudied and unprotected, while efforts are biased towards just a few “popular” species.

Read the rest of this entry »


%d bloggers like this: