How to find fossils

30 03 2016

Many palaeontologists and archaeologists might be a little put out by the mere suggestion that they can be told by ecologists how to do their job better. That is certainly not our intention.

Like fossil-hunting scientists, ecologists regularly search for things (individuals of species) that are rare and difficult to find, because surveying the big wide world for biodiversity is a challenge that we have faced since the dawn of our discipline. In fact, much of the mathematical development of ecology stems from this probabilistic challenge — for example, species distribution models are an increasingly important component of both observational and predictive ecology.

IMG_1277
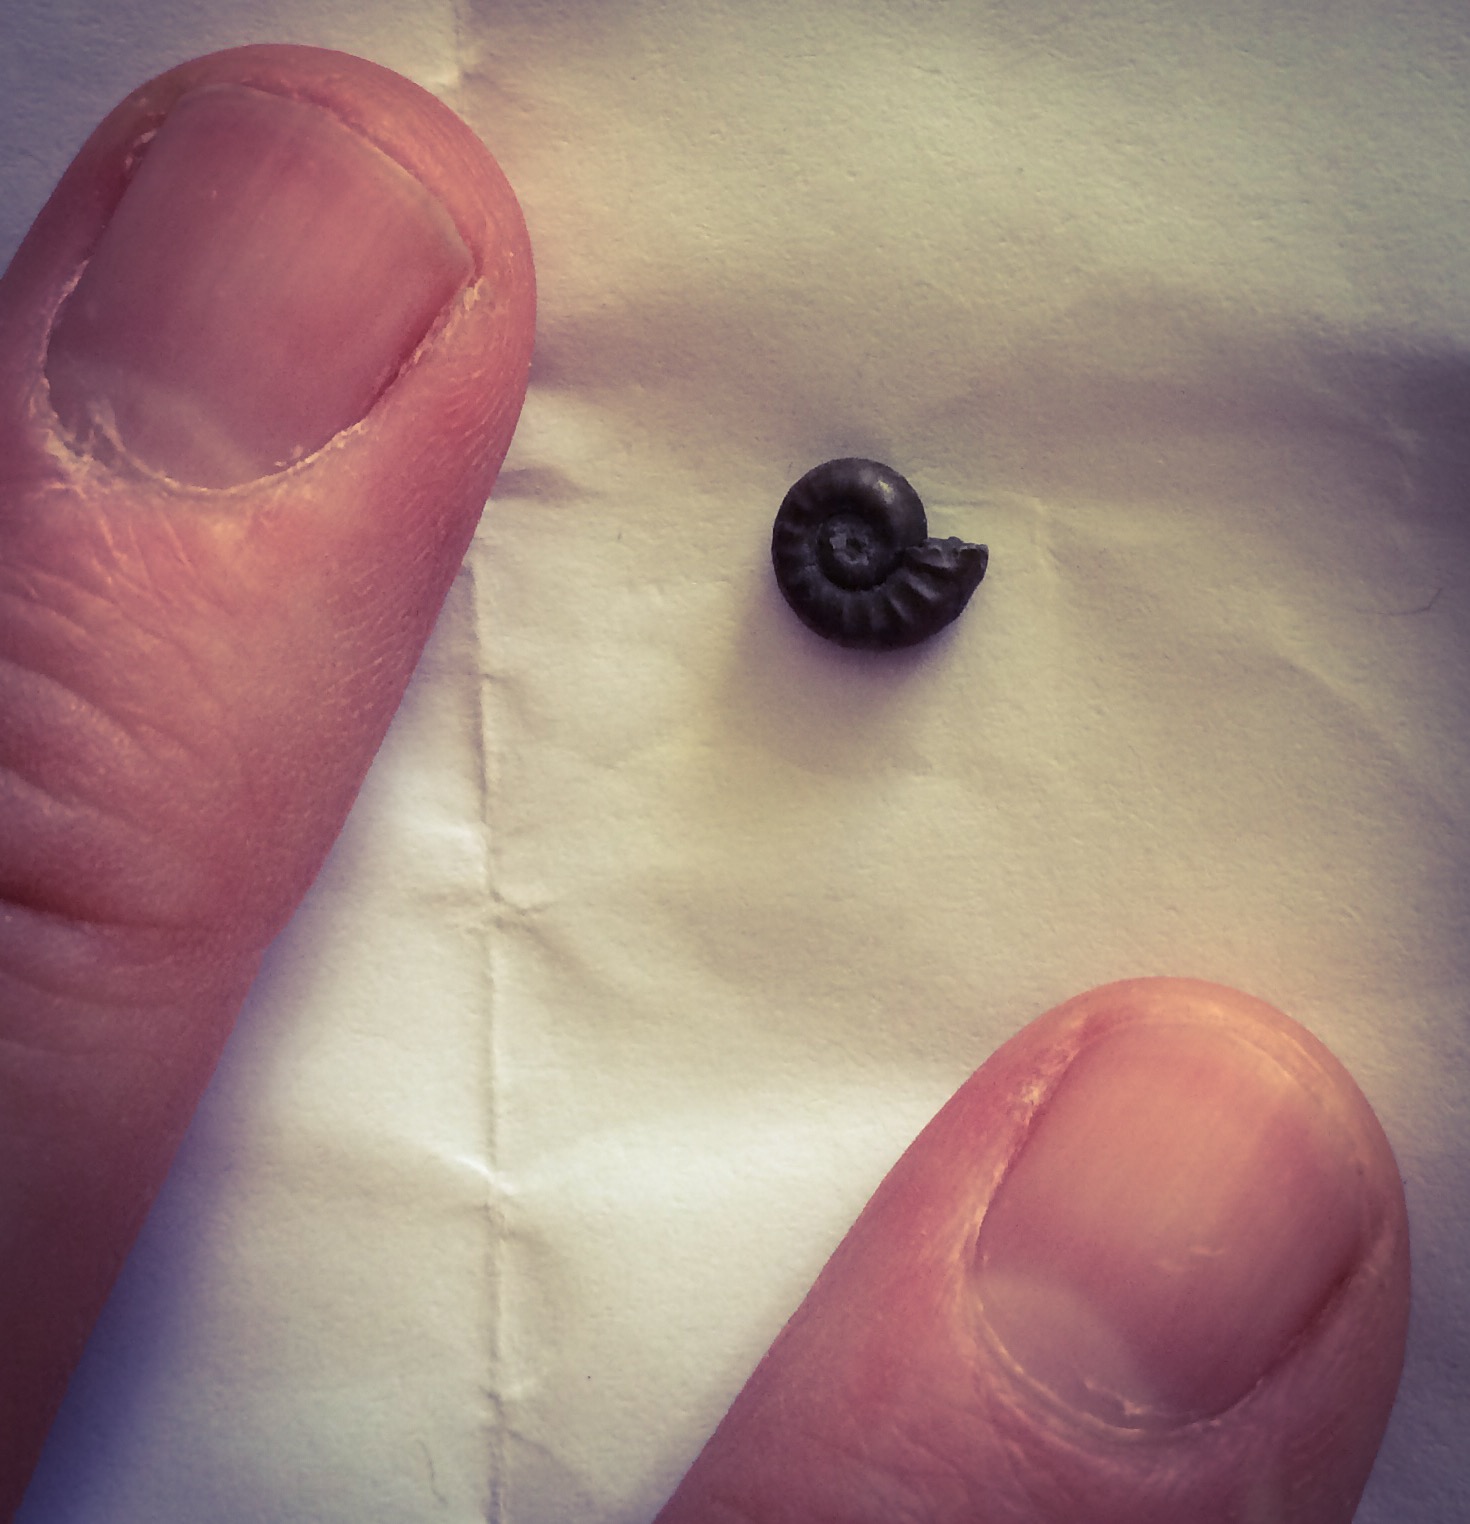
But the palaeo types generally don’t rely on mathematical models to ‘predict’ where fossils might be hiding just under the surface. Even I’ve done what most do when trying to find a fossil — go to a place where fossils have already been found and start fossicking. I’ve done this now with very experienced sedimentary geologists in the Flinders Rangers looking for 550 million year-old Ediacaran fossils, and most recently searching for Jurassic fossils (mainly ammonites) on the southern coast of England (Devon’s Jurassic Coast). My prized ammonite find is shown in the photo to the left.

If you’ve read anything on this blog before, you’ll probably know that I’m getting increasingly excited about palaeo-ecology, with particular emphasis on Australia’s late-Pleistocene and early Holocene mass-extinction of megafauna. So with a beautiful, brand-new, shiny, and quality-rated megafauna dataset1, we cheekily decided to take fossil hunting to the next level by throwing mathematics at the problem.

Just published2 in PloS One, I’m happy to announce our newest paper entitled Where to dig for fossils: combining climate-envelope, taphonomy and discovery models.

Of course, we couldn’t just treat fossil predictions like ecological ones — there are a few more steps involved because we are dealing with long-dead specimens. Our approach therefore involved three steps: Read the rest of this entry »


Sensitive numbers

22 03 2016
toondoo.com

A sensitive parameter

You couldn’t really do ecology if you didn’t know how to construct even the most basic mathematical model — even a simple regression is a model (the non-random relationship of some variable to another). The good thing about even these simple models is that it is fairly straightforward to interpret the ‘strength’ of the relationship, in other words, how much variation in one thing can be explained by variation in another. Provided the relationship is real (not random), and provided there is at least some indirect causation implied (i.e., it is not just a spurious coincidence), then there are many simple statistics that quantify this strength — in the case of our simple regression, the coefficient of determination (R2) statistic is a usually a good approximation of this.

In the case of more complex multivariate correlation models, then sometimes the coefficient of determination is insufficient, in which case you might need to rely on statistics such as the proportion of deviance explained, or the marginal and/or conditional variance explained.

When you go beyond this correlative model approach and start constructing more mechanistic models that emulate ecological phenomena from the bottom-up, things get a little more complicated when it comes to quantifying the strength of relationships. Perhaps the most well-known category of such mechanistic models is the humble population viability analysis, abbreviated to PVA§.

Let’s take the simple case of a four-parameter population model we could use to project population size over the next 10 years for an endangered species that we’re introducing to a new habitat. We’ll assume that we have the following information: the size of the founding (introduced) population (n), the juvenile survival rate (Sj, proportion juveniles surviving from birth to the first year), the adult survival rate (Sa, the annual rate of surviving adults to year 1 to maximum longevity), and the fertility rate of mature females (m, number of offspring born per female per reproductive cycle). Each one of these parameters has an associated uncertainty (ε) that combines both measurement error and environmental variation.

If we just took the mean value of each of these three demographic rates (survivals and fertility) and project a founding population of = 10 individuals for 1o years into the future, we would have a single, deterministic estimate of the average outcome of introducing 10 individuals. As we already know, however, the variability, or stochasticity, is more important than the average outcome, because uncertainty in the parameter values (ε) will mean that a non-negligible number of model iterations will result in the extinction of the introduced population. This is something that most conservationists will obviously want to minimise.

So each time we run an iteration of the model, and generally for each breeding interval (most often 1 year at a time), we choose (based on some random-sampling regime) a different value for each parameter. This will give us a distribution of outcomes after the 10-year projection. Let’s say we did 1000 iterations like this; taking the number of times that the population went extinct over these iterations would provide us with an estimate of the population’s extinction probability over that interval. Of course, we would probably also vary the size of the founding population (say, between 10 and 100), to see at what point the extinction probability became acceptably low for managers (i.e., as close to zero as possible), but not unacceptably high that it would be too laborious or expensive to introduce that many individuals. Read the rest of this entry »


Higher biodiversity imparts greater disease resistance

12 03 2016

fungal infection

Is biodiversity good for us? In many ways, this is a stupid question because at some point, losing species that we use directly will obviously impact us negatively — think of food crops, pollination and carbon uptake.

But how much can we afford to lose before we notice anything bad is happening? Is the sort of biodiversity erosion we’re seeing today really such a big deal?

One area of research experiencing a surge in popularity is examining how variation in biodiversity (biowealth1) affects the severity of infectious diseases, and it is particularly controversial with respect to the evidence for a direct effect on human pathogens (e.g., see a recent paper here, a critique of it, and a reply).

Controversy surrounding the biodiversity-disease relationship among non-human species is less intense, but there are still arguments about the main mechanisms involved. The amplification hypothesis asserts that a community with more species has a greater pool of potential hosts for pathogens, so pathogens increase as biodiversity increases. On the contrary, the dilution hypothesis asserts that disease prevalence decreases with increasing host species diversity via several possible mechanisms, such as more host species reducing the chance that a given pathogen will ‘encounter’ a suitable host, and that in highly biodiverse communities, an infected individual is less likely to be surrounded by the same species, so the pathogen cannot easily be transmitted to a new host (the so-called transmission interference hypothesis).

So I’ve joined the ecological bandwagon and teamed up yet again with some very clever Chinese collaborators to test these hypotheses in — if I can be so bold to claim — a rather novel and exciting way.

Our new paper was just published online in EcologyWarming and fertilization alter the dilution effect of host diversity on disease severity2. Read the rest of this entry »


Cartoon guide to biodiversity loss XXXV

8 03 2016

Another six biodiversity cartoons for you this week (see here for why I provide six each time). See full stock of previous ‘Cartoon guide to biodiversity loss’ compendia here.

Read the rest of this entry »


Environmental Arsehats

3 03 2016

arsehatI’m starting a new series on ConservationBytes.com — one that exposes the worst environmental offenders on the planet.

I’ve taken the idea from an independent media organisation based in Australia — Crikey — who has been running the Golden Arsehat of the Year awards since 2008. It’s a hilarious, but simultaneously maddening, way of shaming the worst kinds of people.

So in the spirit of a little good fun and environmental naming-and-shaming, I’d like to put together a good list of candidates for the inaugural Environmental Arsehat of the Year awards.

So I’m keen to receive your nominations, either privately via e-mail, the ConservationBytes.com message service, or even in the comments stream of this post. Once I receive a good list of candidates, I’ll do separate posts on particularly deserving individuals, followed by an online poll where you can vote for your (least) favourite Arsehat.

There are a few nomination rules, however. Read the rest of this entry »


%d bloggers like this: